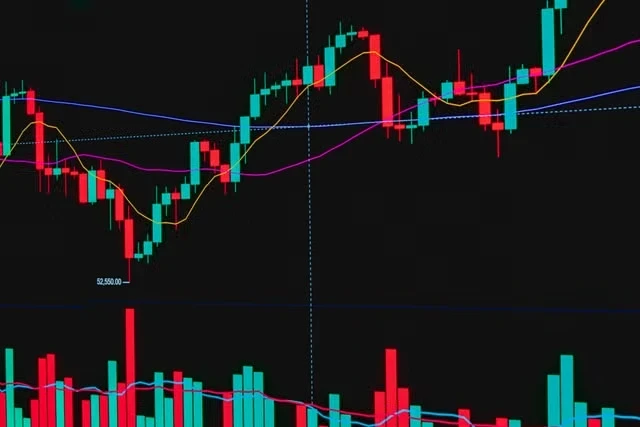
Financial markets operate on a web of correlations that investors treat as near-sacred doctrine. When stocks fall, bonds typically rally, providing a hedge against equity losses. When inflation fears subside, yields ease and growth stocks regain their luster.
Yet the trading session of August 17 shattered these comfortable assumptions, as rising crude prices simultaneously lifted Treasury yields, pressured equities, and reignited inflation anxiety across every major asset class.
This synchronized movement represents more than a single day of market turbulence. It signals a structural shift in how global capital responds to energy shocks, forcing portfolio managers to abandon the traditional risk-off playbook that has guided hedging strategies for decades.
On This Page
- The August 17 Market Dislocation: Anatomy of a Synchronized Selloff
- Geopolitical Oil Shocks and the New Market Playbook
- Portfolio Construction for the Synchronized Market Era
- Dynamic Asset Allocation Frameworks
- Practical Hedging Techniques for Individual Investors
- Monitoring Indicators and Early Warning Systems
- Oil Shock Transmission Chain Metrics
- Hedging Effectiveness Comparison
- Geopolitical Risk Scenarios
- Portfolio Allocation Adjustments
- Central Bank Response Scenarios
- Investor Action Checklist
The oil shock transmission chain now operates with unprecedented speed, connecting crude benchmarks in Houston and Singapore to bond duration decisions in New York and mortgage pricing in suburban America within hours, not weeks.
Understanding this new paradigm requires dissecting the precise mechanisms through which energy prices ripple across fixed income, equities, and currency markets. The following analysis examines the August 17 market action, traces the causal pathways from oil to portfolio construction, and offers practical guidance for investors navigating an era where diversification no longer guarantees protection.
TL;DR Rising oil prices on August 17 triggered a synchronized selloff across bonds and stocks, breaking the traditional inverse correlation that investors rely on for portfolio hedging. The oil shock transmission chain now moves faster than ever, pushing Treasury yields higher while compressing equity valuations, particularly in growth sectors. Investors must rethink diversification strategies as energy-driven inflation becomes a dominant market force, with geopolitical tensions in the Middle East and production cuts amplifying the impact.
The August 17 Market Dislocation: Anatomy of a Synchronized Selloff
The trading session began with crude benchmarks climbing steadily, driven by supply concerns and geopolitical tensions in the Middle East. Brent crude surged past key resistance levels, triggering algorithmic trading systems that automatically adjusted bond and equity positions.
By midday, the correlation matrix across asset classes had inverted, leaving traditional hedges ineffective and forcing rapid portfolio repositioning.
What made this session particularly notable was the speed of transmission. Historically, oil price shocks took weeks to filter through inflation expectations and central bank policy calculations. Today, futures markets price these adjustments within hours, as high-frequency trading algorithms scan energy data alongside employment reports and consumer price indices, creating instantaneous feedback loops across global markets.
The Crude-to-Yield Pipeline
When crude prices rise, inflation expectations embedded in Treasury yields adjust almost immediately. The ten-year note, considered the benchmark for global borrowing costs, saw its yield jump as traders priced in higher future consumer prices.
This movement reflects the market's collective judgment that energy costs will persist, forcing the Federal Reserve to maintain restrictive monetary policy for longer than previously anticipated.
The mechanism operates through breakeven inflation rates, which measure the difference between nominal and inflation-protected Treasury yields. As oil climbs, these breakevens widen, signaling that investors demand greater compensation for expected price increases.
This repricing cascades through the entire yield curve, affecting everything from short-term bills to thirty-year bonds, with duration risk becoming the primary casualty.
Bond fund managers faced a particularly challenging environment, as their duration positioning proved inadequate against the rapid yield spike. Portfolios structured to benefit from falling rates suddenly experienced mark-to-market losses, triggering margin calls and forced selling that amplified the downward pressure. The result was a feedback loop where rising yields begat more selling, which pushed yields higher still.
Central bank communication added another layer of complexity. Federal Reserve officials, while acknowledging the oil price surge, maintained their data-dependent stance, refusing to signal any imminent policy shift. This ambiguity left investors guessing about the trajectory of interest rates, increasing volatility premiums across fixed income markets and making duration management exceptionally difficult.
Equity Valuation Compression
Growth stocks bore the brunt of the equity selloff, as rising discount rates directly reduce the present value of future earnings. Technology companies, particularly those with extended cash flow horizons, saw their valuations compress sharply as traders recalculated net present values using higher yield assumptions. The Nasdaq composite underperformed the broader market, confirming that duration risk extends beyond bonds into equity territory.
The transmission mechanism operates through the equity risk premium, which represents the additional return investors demand for holding stocks over risk-free assets. When Treasury yields rise, this premium compresses, making equities relatively less attractive.
High-multiple growth stocks, which trade on expectations of distant profitability, suffer disproportionately as their cash flows are discounted at higher rates.
Sector rotation accelerated as investors sought refuge in value-oriented industries with shorter cash flow horizons. Energy companies themselves rallied on the oil price surge, while financials benefited from steeper yield curves that improve net interest margins.
This rotation created a bifurcated market where traditional defensive sectors offered little protection, while cyclical value names demonstrated unexpected resilience.
Options markets reflected the heightened uncertainty, with the VIX volatility index climbing to levels not seen since the regional banking crisis earlier in the year. Put-call ratios surged as institutional investors purchased downside protection, while retail traders, emboldened by recent market resilience, continued buying call options on speculative names, creating a tug-of-war between hedging demand and speculative appetite.
Mortgage Rates and the Housing Transmission
The housing market serves as the critical transmission channel between oil prices and Main Street financial conditions. As Treasury yields rise, mortgage rates follow suit, directly impacting affordability for prospective homebuyers.
The thirty-year fixed mortgage rate, which tracks the ten-year Treasury yield with a premium, climbed toward levels that price significant portions of the population out of homeownership.
This dynamic creates a wealth effect that ripples through consumer spending. Existing homeowners with adjustable-rate mortgages face higher monthly payments, reducing discretionary income. Prospective buyers delay purchases, cooling housing demand and potentially softening home prices. The construction sector, sensitive to financing costs, may reduce new housing starts, affecting employment in related industries.
Refinancing activity, which surged during the pandemic-era low-rate environment, has virtually dried up as current homeowners hold mortgages at rates well below prevailing market levels. This "rate lock" effect reduces housing market liquidity, as homeowners hesitate to sell and forfeit their favorable financing terms. The resulting supply constraint may paradoxically support prices even as demand weakens.
Commercial real estate faces similar pressures, with office and retail properties particularly vulnerable to higher capitalization rates. Property values decline as cap rates rise, potentially triggering distress in loans backed by these assets.
Regional banks, already grappling with deposit outflows and unrealized bond losses, face additional strain from commercial real estate exposure, creating systemic risk that regulators monitor closely.
Geopolitical Oil Shocks and the New Market Playbook
Geopolitical tensions in the Middle East have historically provided the backdrop for oil price spikes, and the current environment is no exception. Supply disruptions, whether from actual conflicts or the threat of them, introduce a risk premium into crude prices that persists until the situation stabilizes.
The market's response to these geopolitical factors has evolved, with algorithmic trading amplifying moves and reducing the time available for human judgment.
Investors must now navigate a landscape where traditional diversification strategies fail precisely when they are needed most. The correlation between stocks and bonds, which turned negative during the 2000s and 2010s, has reverted toward positive territory during inflationary episodes.
This regime shift demands a fundamental reconsideration of portfolio construction, moving beyond the simple 60/40 allocation that dominated institutional investing for decades.
Commodity-Linked Hedging Strategies
Direct commodity exposure offers one avenue for hedging against oil-driven inflation, though it comes with significant volatility and storage considerations. Exchange-traded products tracking crude futures provide accessible exposure, but their roll costs can erode returns over time.
Investors must weigh these costs against the potential benefits of having a portfolio component that appreciates when energy prices surge.
Energy equity positions offer a hybrid approach, providing commodity price exposure with the operational leverage of producing companies. Integrated majors with strong balance sheets and diversified operations may offer more stability than pure-play exploration companies.
However, equity prices incorporate additional risks, including operational disruptions, regulatory changes, and the long-term transition away from fossil fuels.
Inflation-linked bonds, particularly Treasury Inflation-Protected Securities, provide direct protection against consumer price increases. Their principal adjusts with the CPI, ensuring that investors maintain purchasing power regardless of inflation trajectory.
However, these instruments offer limited real yields when inflation expectations are already elevated, and their duration characteristics may not align with all portfolio objectives.
Alternative assets, including infrastructure and real estate, have historically provided some inflation protection through their ability to adjust pricing. Toll roads, pipelines, and other infrastructure assets often have contractual inflation adjustments built into their revenue streams.
Real estate leases, particularly in commercial sectors, may include escalation clauses that pass through cost increases to tenants.
Duration Management in a Rising Yield Environment
Fixed income investors face a fundamental challenge when yields rise: existing bond prices fall, and the reinvestment of coupon payments occurs at higher rates. This creates a tradeoff between price risk and reinvestment risk that duration management must address.
Shortening portfolio duration reduces price sensitivity but sacrifices yield, while extending duration locks in current rates but increases vulnerability to further increases.
Laddered bond portfolios offer a middle ground, distributing maturities across multiple years to balance these competing risks. As each rung matures, proceeds are reinvested at prevailing rates, gradually increasing portfolio yield without concentrating reinvestment at a single point. This approach provides a steady income stream while maintaining flexibility to adapt to changing rate environments.
Floating rate instruments, including bank loans and floating rate notes, adjust their coupon payments with benchmark rates, providing natural protection against rising yields. These instruments trade at relatively stable prices since their cash flows increase with rates.
However, they typically offer lower initial yields than fixed-rate alternatives, and their credit risk may be higher, particularly for below-investment-grade issuers.
Derivative strategies, including interest rate swaps and Treasury futures, allow sophisticated investors to adjust duration exposure without selling underlying bonds. These instruments provide precise control over portfolio characteristics but introduce counterparty risk and require ongoing monitoring.
For most investors, simpler approaches such as bond fund selection or ETF duration targeting may prove more practical.
Geopolitical Risk Assessment Frameworks
Systematic geopolitical risk assessment has become essential for portfolio management in an era of frequent supply disruptions. Investors must monitor not only actual conflicts but also the diplomatic posturing, sanctions threats, and production decisions that shape oil market expectations.
The OPEC+ cartel's production policy, in particular, has emerged as a critical variable that can offset or amplify geopolitical tensions.
Scenario analysis provides a structured approach to evaluating potential outcomes, from benign resolutions to full-scale supply disruptions. Each scenario carries different implications for oil prices, inflation, and central bank policy, requiring distinct portfolio responses. Stress testing portfolios against these scenarios reveals vulnerabilities that might otherwise remain hidden until market stress exposes them.
Real-time monitoring of shipping routes, pipeline infrastructure, and production facilities offers early warning signals of potential disruptions. Satellite imagery, tanker tracking data, and industry reports provide granular information that complements traditional news sources. Quantitative models that incorporate these data streams can identify emerging risks before they fully materialize in market prices.
The interplay between geopolitical events and market reactions is not always linear. Markets may initially overreact to threats, only to reverse course when actual supply impacts prove limited. Conversely, seemingly minor incidents can trigger outsized responses if they occur during periods of low market liquidity or high speculative positioning. Understanding these dynamics requires both quantitative analysis and qualitative judgment.
We Also Published
Portfolio Construction for the Synchronized Market Era
The August 17 session demonstrated that traditional portfolio construction frameworks require fundamental revision. The assumption that stocks and bonds provide natural diversification, which underpinned the 60/40 portfolio for generations, no longer holds during inflationary episodes driven by supply shocks. Investors must embrace a more nuanced approach that acknowledges the interconnectedness of global asset markets.
This new paradigm demands attention to factor exposures rather than simple asset class labels. Value stocks, which have historically provided some inflation protection through their shorter cash flow horizons, may outperform growth stocks during oil-driven inflation.
Similarly, commodities and inflation-linked bonds offer direct protection that traditional nominal bonds cannot provide in a rising rate environment.
Dynamic Asset Allocation Frameworks
Static asset allocation, which maintains fixed portfolio weights regardless of market conditions, has given way to dynamic approaches that adjust exposures based on prevailing economic regimes. These frameworks monitor indicators such as inflation trends, yield curve shape, and commodity prices to determine whether the market is in a risk-on or risk-off phase. When oil prices surge, the framework may reduce duration exposure and increase commodity-linked allocations.
Risk parity strategies, which allocate based on risk contribution rather than capital, offer an alternative to traditional allocation methods. These approaches typically overweight bonds relative to stocks, reflecting their lower volatility.
However, during synchronized selloffs where both asset classes decline, risk parity portfolios may experience losses that their historical backtests did not anticipate.
Factor-based investing provides another lens for portfolio construction, emphasizing characteristics such as value, momentum, quality, and low volatility. During oil-driven inflation, value and quality factors have historically outperformed, while momentum may suffer as trends reverse abruptly.
Factor timing, though challenging, can enhance returns for investors willing to accept the complexity and potential for underperformance.
Alternative risk premia strategies, including carry, trend-following, and volatility selling, offer diversification benefits that may persist during synchronized market moves. Managed futures, in particular, have historically performed well during equity market stress, as trend-following algorithms capture the directional moves in commodities, currencies, and fixed income. These strategies require specialized expertise and may not be accessible to all investors.
Practical Hedging Techniques for Individual Investors
Individual investors, lacking the resources of institutional portfolio managers, must employ simpler hedging techniques that remain effective during synchronized selloffs. Maintaining a cash buffer provides flexibility to rebalance when opportunities arise, while limiting exposure to forced selling during market stress. Cash also earns meaningful yields in the current environment, reducing the opportunity cost of holding it.
Dividend-paying stocks, particularly those with consistent payout histories and strong balance sheets, offer a degree of downside protection during market selloffs. These companies generate cash flows that support their dividends even when earnings decline, providing income that partially offsets capital losses. However, investors must avoid yield traps where high dividends signal financial distress rather than stability.
International diversification, once considered a reliable hedge against domestic market declines, has become less effective as global markets increasingly move in tandem. Correlations between major equity markets have risen over the past decade, driven by synchronized central bank policies and global supply chains. Investors seeking true diversification must look beyond geographic allocation to factor and style exposures.
Regular portfolio rebalancing, whether on a calendar basis or triggered by deviation thresholds, enforces discipline during volatile markets. Rebalancing forces investors to sell assets that have appreciated and buy those that have declined, effectively buying low and selling high. This mechanical approach removes emotion from investment decisions and maintains the desired risk profile over time.
Monitoring Indicators and Early Warning Systems
Effective portfolio management requires monitoring a dashboard of indicators that signal shifts in the oil-to-market transmission chain. The spread between Brent and West Texas Intermediate crude prices reveals supply dynamics and transportation constraints. Inventory data from the Energy Information Administration provides insight into demand trends and potential supply gluts or shortages.
Breakeven inflation rates derived from Treasury markets offer real-time estimates of market inflation expectations. When these rates rise sharply, they signal that investors anticipate higher future inflation, which may prompt central bank tightening. Monitoring these rates alongside oil prices provides early warning of potential synchronized market moves.
The dollar's trajectory influences oil prices and global capital flows, creating another transmission channel. A strengthening dollar typically pressures oil prices, as crude is priced in dollars and becomes more expensive for foreign buyers. Conversely, dollar weakness supports oil prices and may attract capital to commodity-producing economies, affecting equity markets globally.
Central bank communication, including speeches, meeting minutes, and economic projections, provides insight into policy trajectories that shape market expectations. The Federal Reserve's shift toward data dependence has increased the importance of economic indicators such as employment reports and inflation data. Investors must parse these communications carefully to anticipate policy responses to oil-driven inflation.
The synchronized movement of oil, bonds, and stocks on August 17 represents a defining moment for modern portfolio management. The traditional playbook, which treated these asset classes as independent sources of diversification, has proven inadequate in an era of energy-driven inflation.
Investors who adapt their frameworks to acknowledge these interconnections will be better positioned to navigate future market dislocations.
The oil shock transmission chain, from crude prices to bond yields to equity valuations, operates with unprecedented speed and precision. Understanding this chain is no longer optional for serious investors; it is essential for preserving capital and achieving long-term objectives. The tools and frameworks outlined in this analysis provide a foundation for that understanding.
Geopolitical risk assessment, duration management, and dynamic asset allocation have emerged as critical competencies for portfolio managers. These skills, once considered specialized, are now required for anyone seeking to build resilient portfolios in a world where traditional correlations no longer hold.
The August 17 session was not an anomaly but a preview of the market dynamics that will define the coming years.
Investors who embrace this new paradigm, rather than clinging to outdated assumptions, will find opportunities amid the volatility. The synchronized selloff created dislocations that disciplined investors can exploit through systematic rebalancing and strategic allocation shifts. The key is maintaining the flexibility to adapt as market conditions evolve.
From our network :
- The Final Descent: How ESA Retired the Legendary Cluster Constellation After 24 Years of Space Weather ScienceAfter 24 years mapping Earth’s magnetosphere, ESA’s Cluster mission concluded with a precisely controlled reentry over the South Pacific. This analysis explores the scientific legacy, engineering decisions, and debris mitigation principles behind one of space exploration’s most responsible retirements.
- Committed Mediterranean Precipitation Decline: Why Emissions Cuts Alone Cannot Restore Winter RainsNew NOAA research reveals that Mediterranean winter rains may decline irreversibly even with emissions cuts. Explore the science of committed climate change and regional impacts.
- CISA’s Ten-Advisory Wave: Why Generic Patching Fails in OT and How to Build Product-Specific PlaybooksCISA released ten ICS advisories in one week, exposing critical infrastructure risks. Generic patching fails in OT. Learn to build product-specific remediation playbooks.
- The Hidden Cost of AI Convenience: Why Over-Permissioned Agents Are a Security Time BombDiscover why AI agents with excessive permissions create dangerous single points of failure, and learn how implementing least privilege principles can protect your organization from exploitation.
- Former Soap Stars Embark on Ambitious Writing Projects and Theatrical StagesDiscover how former soap opera actors are transitioning into independent scriptwriting and high-profile theatrical stage productions.
- How AI Agents Will Change the Way We Manage Personal FinancesExplore how AI agents are transforming personal finance through automated budgeting, bill payment, and investment management, while examining the critical security protocols and governance frameworks required for safe deployment.
- Analyzing Hoya Corporation’s Midday Volume Shifts and Financial FundamentalsExamine Hoya Corporation’s midday trading volume contraction, technical moving averages, robust solvency ratios, and stellar quarterly earnings performance.
- Forbidden Matrix Patterns and Visible Lattice Points: A Geometric DictionaryExplore how multidimensional 0–1 matrices encode geometric truths, linking forbidden patterns to visible lattice points and hypergraph theory, with applications in combinatorics and computational geometry.
- Norbert’s Uncertain Path: Why Hawaii’s Storm Watch Demands Patience Over PanicTropical Storm Norbert strengthens in the Eastern Pacific with winds near 50 mph, forecast to reach Category 1 hurricane status by Friday. Long-range models disagree sharply on whether Hawaii faces any threat around September 19–23, making official guidance essential.
RESOURCES
- 10-year Treasury yield climbs to highest level since January 2025 as ...finance.yahoo.comJul 23, 2026 ... Global Bond Yields Jump as Oil Prices Surge, Inflation Fears Mount ... Rising Oil Prices Pressure Bond Market Again. The…
- Global Bond Yields Jump as Oil Prices Surge, Inflation Fears Mountwsj.comJul 23, 2026 ... The result was a fresh risk premium in crude and a renewed market focus on inflation, Saxo analysts said in…
- How Do Changing Interest Rates Affect the Stock Market? - U.S. Bankusbank.comAug 3, 2026 ... Learn how Fed policy, bond yields, inflation, and sector leadership can influence stock market performance.
- Iran Conflict: Seven Takeaways for Investors | Morgan Stanleymorganstanley.comMar 3, 2026 ... Prolonged conflict with Iran could lead to higher oil prices, hotter inflation and greater market uncertainty. ... bond yields—a potential ...
- Exploring the dynamic connections between oil price shocks and ...sciencedirect.comOct 15, 2024 ... Overall, the interplay between oil prices, economic activity, inflation, and government finances can significantly impact bond yields, ...
- Stock market news for June 3, 2026 - CNBCcnbc.comJun 3, 2026 ... Dow closes 600 points lower as rising Treasury yields and oil prices pressure stocks: Live updates ... inflation. The 30-stock…
- US stocks erase sharp losses, while oil prices leap on worries about ...abc7news.comMar 2, 2026 ... Lower interest rates can boost the economy and job market, but they also worsen inflation. Higher rates can do the…
- Treasury yields up as oil prices jump, investors await inflation datacnbc.com7 days ago ... Follow your favorite stocksCREATE FREE ACCOUNT. A trader works on the floor of the New York Stock Exchange. NYSE. Treasury…
- Bonds, stocks jolted as Middle East tensions shatter market calmreuters.com18 hours ago ... ... inflation worries and pressured stocks. Oil prices were in positive territory for the third consecutive day, with Brent crude…
- New Inflation Rate High of 7.5% Could Affect Real Return on ... - NAICcontent.naic.orgAs a result, gas prices remain elevated. Financial market reactions include a drop in stocks and an increase in bond yields. The Standard &…
- Bond Yields Rise as Oil Prices Add Inflation Pressure - Investopediainvestopedia.comMar 3, 2026 ... Traders work on the floor of the New York Stock Exchange during afternoon trading on March 03, 2026 in New…
- Stock Markets Are Increasingly Vulnerable to Rising Bond Yieldsgoldmansachs.comMay 22, 2026 ... “If oil disruptions continue into the second half of this year and inflation ... Will the stock market fall if…
- Oil prices rise, and stocks drop worldwide after Trump says ceasefire ...abc7ny.comJul 8, 2026 ... They were hurt by worries that rising Treasury yields in the bond market will mean higher rates for mortgages and…
- U.S. stocks rise to a record as oil prices drop - Spectrum Newsspectrumlocalnews.com5 days ago ... ... interest rates. Treasury yields sank in the bond market, which eases pressure on stocks and other investments. The yield…
- US Stocks Slip and Oil Prices Leap as War in the Middle East ...news.wttw.comMar 2, 2026 ... Lower interest rates can help the economy and job market, while also worsening inflation. Higher rates can do the opposite.…
- 01
- 02
- 03
- 04
- 05
- 06
- 07
- 08
0 Comments