
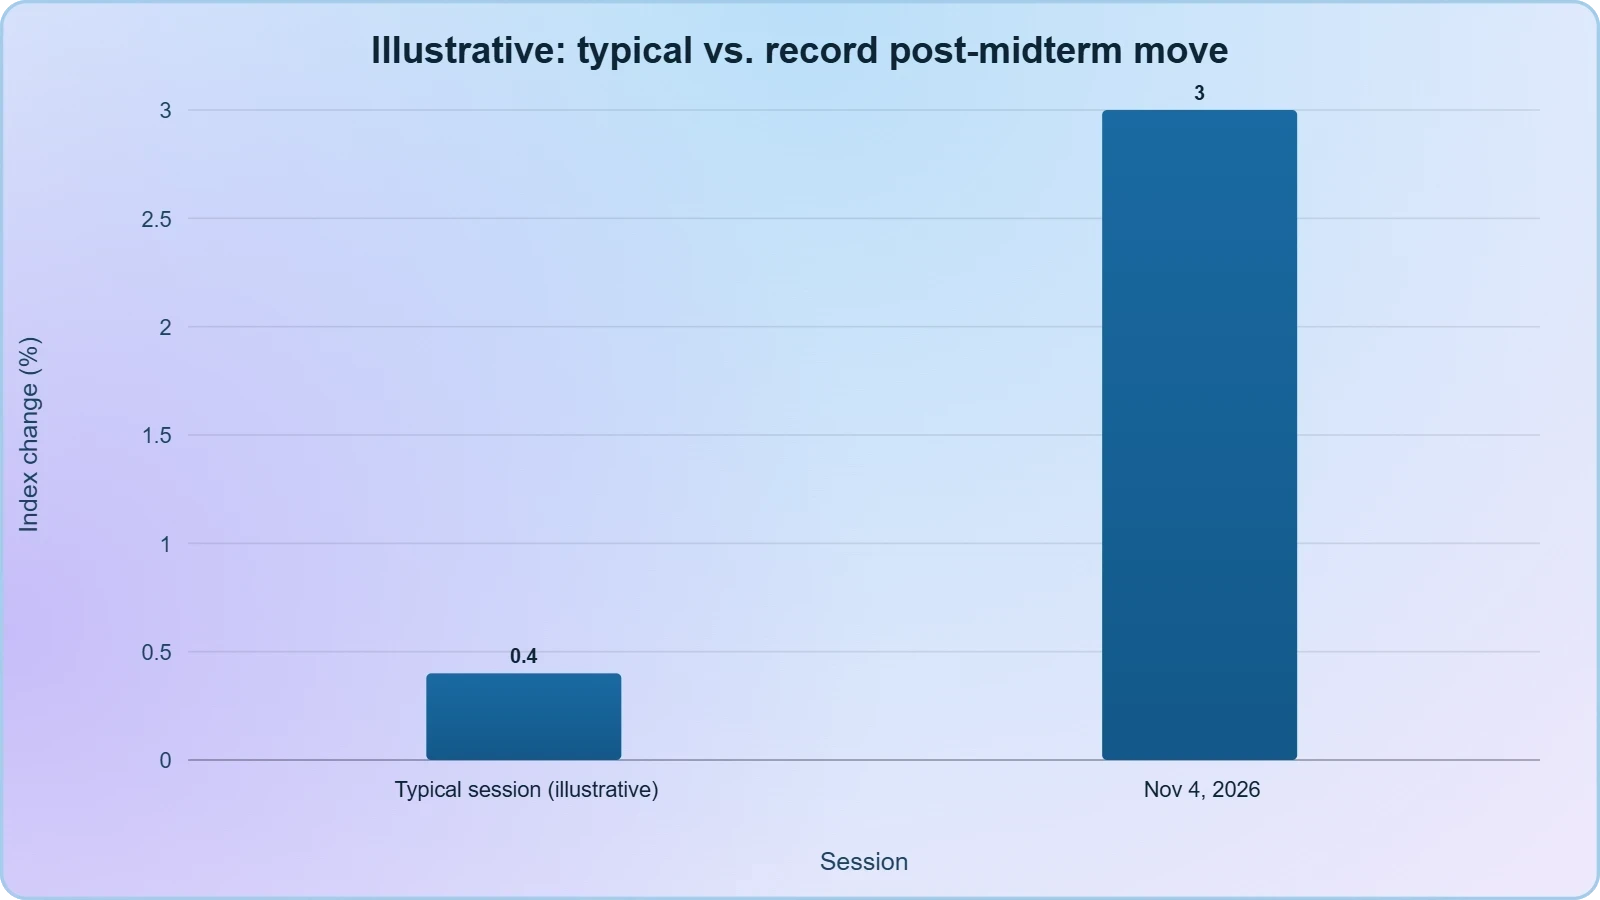
When the Dow Jones Industrial Average climbed 3% on November 4, 2026, in the immediate wake of the United States midterm elections, it did more than extend a single trading session's optimism. It registered the largest post-midterm rally in 44 years, a threshold not crossed since 1978, according to reporting by The Globe and Mail. That single data point carries outsized interpretive weight, because equity markets are rarely moved by election results alone; they are moved by what those results imply about taxation, regulation, fiscal spending, and the stability of the policy environment in which capital must be deployed.
The mechanics of a post-election rally deserve careful unpacking. Markets price uncertainty, and elections are among the purest forms of uncertainty a developed economy can generate. When the ballot count resolves and the legislative map becomes legible, the discount rate applied to future cash flows can compress, and equity valuations adjust upward. A 3% single-day move on a blue-chip index is not a trivial repricing; it represents hundreds of billions of dollars in aggregate market capitalization shifting in a matter of hours, reflecting institutional repositioning, algorithmic momentum, and retail sentiment converging at once.
What follows examines the November 4 session through the lens of market structure, historical precedent, and the political economy of midterm cycles. It considers why the 1978 comparison matters, how sector rotation typically unfolds after midterms, what the absence of granular detail in early reporting implies about information asymmetry, and how investors should interpret a headline number that is simultaneously precise and incomplete. The aim is not to celebrate a rally but to understand the machinery beneath it.
On This Page
TL;DR The Dow Jones Industrial Average rose 3% on November 4, 2026, the day after the U.S. midterm elections, marking the largest post-midterm gain in 44 years and the strongest such rally since 1978. The move reflects the resolution of political uncertainty rather than a verdict on specific policies, and early reporting from The Globe and Mail offered no detail on the election outcome or the drivers behind the session. Investors should read the number as a signal of uncertainty compression, not as a durable directional forecast, and should watch sector rotation, bond yields, and legislative follow-through in the weeks ahead.
The Anatomy of a Post-Election Market Shock
A 3% move in the Dow is best understood as the market's collective act of repricing political risk. Before polls close, investors hold positions hedged against multiple electoral outcomes, and that hedging carries a cost. Once the result is known, those hedges unwind, capital redeploys toward sectors expected to benefit from the incoming legislative configuration, and the index absorbs the net effect. The November 4 session compressed what might otherwise have unfolded over several weeks into a single trading day, which is precisely why the percentage gain looks so dramatic in isolation.
Why Uncertainty Compression Drives Index Moves
Financial theory treats uncertainty as a cost embedded in the discount rate. When the range of plausible policy outcomes narrows, the variance of expected future cash flows declines, and the present value of those cash flows rises even if the underlying earnings forecast is unchanged. This is the mechanism behind so-called relief rallies, and it explains why markets sometimes rise after elections regardless of which party prevails. The direction of policy matters, but the certainty of knowing that direction matters first, and the November 4 gain is a textbook illustration of that sequencing.
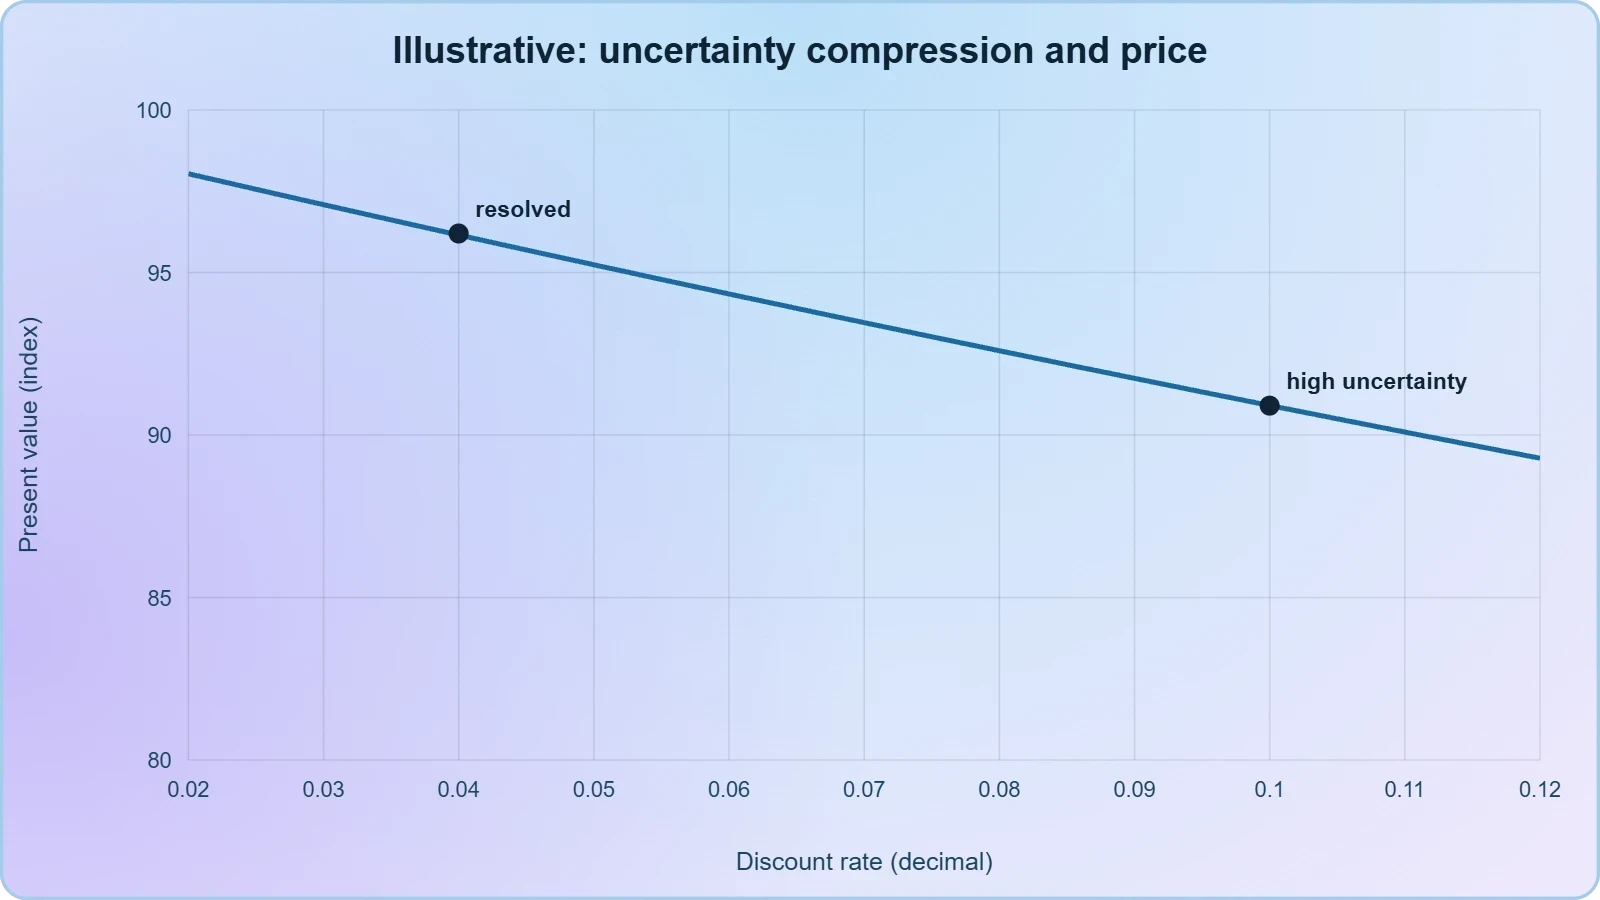
The magnitude also depends on how much uncertainty was priced in beforehand. A closely contested midterm with control of Congress genuinely in doubt forces investors to hold larger cash buffers and wider option hedges than a race with a predictable outcome. When the result lands, the release of that pent-up positioning can amplify the move well beyond what fundamentals alone would justify. A 3% index gain therefore tells us more about the pre-election hedging posture than about any single policy expectation.
The Role of Liquidity and Algorithmic Execution
Modern equity markets convert information into price with extraordinary speed, and a large share of the November 4 volume was likely executed by systematic strategies responding to volatility signals rather than to the election itself. When realized volatility falls after an event risk passes, volatility-targeting funds mechanically increase equity exposure, and trend-following models add to positions once key technical levels break. These flows are reflexive: the initial move triggers further buying, which validates the move, which attracts more buying, until the index settles at a new equilibrium.
This does not diminish the significance of the rally, but it does complicate the narrative. A headline that attributes a 3% gain solely to election results oversimplifies a process in which human judgment, institutional rebalancing, and machine execution all participate. Understanding the layered causality helps investors avoid the trap of assuming that the same election outcome would produce the same market reaction under different liquidity conditions or a different starting valuation.
Historical Precedent: The 1978 Benchmark
To say a rally is the largest in 44 years is to invoke 1978, and that comparison is more than a statistical curiosity. The late 1970s were a period of entrenched inflation, volatile energy markets, and deep skepticism about American economic management. A strong post-midterm session in that environment reflected a market desperate for any signal of policy coherence. The 2026 comparison therefore invites a question: is the current rally a sign of confidence in the political outcome, or a release of tension in a market that had grown unusually anxious about the direction of governance?
What the 1978 Comparison Reveals
Historical analogies in markets are useful precisely because they are imperfect. The 1978 rally occurred in a market structure radically different from today's: no high-frequency trading, no passive index funds of meaningful scale, no options market of comparable depth. What carries over is the psychological pattern, in which an electorate's decision removes a layer of ambiguity and capital responds. What does not carry over is the transmission mechanism, because today's flows are faster, more leveraged, and more globally interconnected than anything the 1978 market could have produced.
The 44-year gap also matters because it establishes rarity. A record that has stood for more than four decades suggests that post-midterm sessions are typically muted affairs, with gains or losses measured in fractions of a percent. When that pattern breaks decisively, it signals that the pre-election uncertainty was unusually elevated or that the outcome was unusually consequential for the sectors that dominate the Dow. Either interpretation points to the same conclusion: something about this cycle was different.
Midterm Cycles and the Equity Risk Premium
Academic work on political cycles has long noted that equity returns tend to be stronger in the twelve months following midterm elections than in the twelve months preceding them, a pattern often attributed to the resolution of uncertainty and the tendency of legislative risk to peak before the vote. The November 4 session may be an unusually concentrated expression of that broader tendency. Investors who study the pattern should nonetheless resist treating it as a rule, because the sample of midterm cycles is small and the outcomes are heavily conditioned on valuation, monetary policy, and the state of the business cycle at the time of the vote.
The equity risk premium, the excess return investors demand for holding stocks over risk-free assets, is the conceptual bridge between politics and prices. Elections alter expectations about taxes, spending, and regulation, all of which feed into the premium. A sharp post-election rally is, in effect, the market declaring that the premium it had demanded was too high relative to the newly clarified policy landscape. Whether that declaration proves correct depends on what legislators actually do once seated.
We Also Published
Sector Rotation and the Composition of the Dow
The Dow Jones Industrial Average is a price-weighted index of thirty large-capitalization companies, and its composition shapes how it responds to political news. Because higher-priced stocks carry greater weight regardless of market capitalization, the index's moves can be dominated by a handful of names. A 3% gain therefore does not necessarily mean that all thirty components rose by similar amounts; it may reflect concentrated strength in a few heavily weighted constituents whose outlooks are especially sensitive to the election outcome.
Which Sectors Typically Lead After Midterms
Post-election sector rotation follows a recognizable logic. Companies exposed to regulated industries, such as utilities, healthcare, and financial services, tend to react strongly to shifts in the legislative balance because their earnings are directly shaped by rulemaking. Industrials and materials respond to expectations about infrastructure spending and trade policy. Energy reacts to signals about permitting and environmental regulation. When the election result clarifies which party controls which chamber, capital flows toward the sectors whose regulatory environment is most likely to change.
The Dow's industrial character means it is particularly attuned to expectations about capital expenditure, manufacturing policy, and global trade. A rally of this magnitude suggests that investors read the outcome as favorable to large, established industrial enterprises, whether through anticipated tax treatment, reduced regulatory burden, or simply the removal of the possibility of adverse legislative change. The index's price weighting can amplify these effects when the most politically sensitive names happen to carry high share prices.
Reading the Rally Beyond the Headline Number
A single index figure conceals as much as it reveals. Sophisticated investors look past the headline to breadth, which measures how many components participated in the advance, and to volume, which indicates conviction behind the move. A 3% gain driven by broad participation carries a different message than the same gain driven by two or three names. Early reporting did not supply these details, which is itself an important observation about the limits of headline-driven analysis and the value of waiting for fuller market data.
Investors should also distinguish between a repricing and a trend. A one-day move reflects the resolution of a specific uncertainty, while a durable trend requires sustained earnings growth, supportive monetary conditions, and policy follow-through. The November 4 session is best treated as the market's opening assessment of the new political configuration, not as a forecast of the year ahead. The weeks following will reveal whether the initial enthusiasm is confirmed by legislative action or fades as other risks reassert themselves.
- 01
- 02
- 03
- 04
Information Gaps and the Discipline of Skepticism
The Globe and Mail report, as summarized, states the gain and the historical comparison but does not specify which party won which chamber, what the exit polling showed, or which sectors drove the advance. This omission is not a flaw in the reporting so much as a reminder that early market coverage prioritizes speed over completeness. For investors, the practical lesson is that a headline number without context is a starting point for inquiry, not a conclusion. The absence of detail should prompt questions rather than assumptions.
Why Early Reports Omit the Drivers
Financial newswires operate under intense time pressure, and the first iteration of a market story is often built from index-level data and a press release rather than from a full analysis of sector performance, options positioning, and macroeconomic context. The result is a headline that captures the most striking fact, in this case the 44-year record, while leaving the causal story for later coverage. Readers who act on the first headline without waiting for the fuller picture are effectively trading on a fragment of information.
There is also a structural reason for the gap: the drivers of a rally are often contested even after the fact. Analysts may disagree about whether the move reflected tax expectations, regulatory relief, or simply the unwinding of hedges. The market's aggregate verdict is observable in the price, but the weights assigned to each contributing factor are inferred rather than measured. This epistemic humility is essential for anyone attempting to draw durable conclusions from a single session's data.
Building a More Complete Picture
Investors seeking a fuller understanding should look beyond the index headline to sector-level performance, the VIX and other volatility measures, Treasury yields, and currency moves. A rally accompanied by falling yields and a weaker dollar tells a different story than one accompanied by rising yields and a stronger dollar. Breadth statistics, advance-decline lines, and options skew add further texture. None of these were available in the initial report, which is precisely why the disciplined response is to wait for confirmation before adjusting a portfolio.
The broader principle is that markets are information-processing systems, and the quality of any individual decision depends on the quality of the information feeding it. A 3% headline is a powerful attention magnet, but attention is not the same as understanding. The investor who asks what was not reported, and why, is better positioned than the one who simply reacts to the number. Skepticism, applied constructively, is a form of risk management.
Macro Context: Rates, Inflation, and the Policy Mix
An election rally does not occur in a vacuum, and the November 4 session must be read against the prevailing monetary and fiscal backdrop. If inflation is moderating and the central bank is signaling a pause or pivot, the political clarity amplifies an already supportive environment. If inflation is reaccelerating and rates are rising, a political rally may be fighting a stronger current. The report does not specify the macro conditions, but any serious interpretation of a 44-year record must account for them, because the same election outcome can produce very different market responses depending on the rate regime.
The Interaction Between Politics and Monetary Policy
Midterm elections shape the fiscal trajectory, and fiscal policy in turn shapes the inflation and rate outlook that the central bank must navigate. A legislature inclined toward deficit spending can push yields higher, which pressures equity valuations even as it supports nominal growth. A legislature inclined toward restraint can do the opposite. The market's 3% response suggests that investors initially read the outcome as supportive of the earnings outlook without triggering an adverse rate reaction, but that judgment is provisional and will be tested as the policy agenda takes shape.
The relationship is further complicated by the independence of the central bank. Markets price the expected path of policy rates based on their assessment of inflation and employment, and political outcomes influence that path only indirectly, through fiscal expectations and risk sentiment. Investors who attribute the entire rally to the election risk overstating the political signal and understating the monetary one. The more defensible reading is that the election removed a source of uncertainty at a moment when the rate outlook was already the dominant variable.
Global Spillovers and the Dollar
The Dow does not trade in isolation, and a large post-election move in New York typically reverberates through global markets. Equity indices in Europe and Asia often follow the U.S. lead, and the dollar's reaction reflects shifting expectations about relative growth and rate differentials. A rally accompanied by dollar strength suggests confidence in U.S. growth; a rally accompanied by dollar weakness suggests a more nuanced read. The initial report does not specify these cross-asset moves, but they are essential to understanding whether the session represented a genuine re-rating or a localized technical event.
For international investors, the spillover matters because U.S. equities represent a large share of global portfolios and because American policy choices shape trade, capital flows, and regulatory norms worldwide. A midterm outcome that alters the U.S. legislative balance can therefore affect emerging market currencies, commodity prices, and cross-border investment decisions. The November 4 rally is a U.S. story on its surface, but its implications extend well beyond the thirty companies that comprise the Dow.
Practical Takeaways for Investors
The most useful response to a headline like this is neither euphoria nor dismissal but a structured process. Investors should ask what the move implies about the distribution of future outcomes, whether their portfolios are positioned for the sectors most affected, and what evidence would confirm or refute the market's initial read. A 3% gain is a signal worth examining, but it is not a mandate to chase. The discipline lies in translating the signal into a set of testable expectations and then monitoring the data that will validate or invalidate them.
Positioning for the Post-Election Period
Portfolio positioning after a midterm should begin with an honest assessment of existing exposures. Investors who were underweight the sectors that led the rally may face a decision about whether to add exposure or to accept the relative underperformance. Those who were already positioned for the outcome must decide whether to take profits or let the position run. Neither choice is universally correct; both depend on time horizon, risk tolerance, and the strength of the underlying thesis. The rally itself provides information, but the response should be governed by process rather than by the emotion of the moment.
Diversification remains the most reliable defense against the possibility that the initial market read is wrong. A rally driven by uncertainty resolution can reverse if the legislative agenda proves more disruptive than expected, and concentrated bets on a single interpretation of the election expose the portfolio to that risk. Rebalancing toward target weights, maintaining adequate liquidity, and stress-testing the portfolio against adverse policy scenarios are unglamorous but effective practices in the aftermath of a large move.
What to Watch in the Weeks Ahead
The weeks following the election will provide the evidence needed to evaluate the November 4 rally. Legislative leadership announcements, committee assignments, and early signals about the policy agenda will indicate whether the market's optimism is warranted. Sector performance relative to the broad index will show whether the rotation has legs. Bond yields and inflation data will reveal whether the fiscal outlook is compatible with the rate environment that equity valuations assume. Each of these data points refines the picture that the initial headline left incomplete.
Investors should also watch for the possibility of a fade, in which the initial gain partially reverses as the market digests details that were not available on the day. Such fades are common after event-driven rallies and do not necessarily invalidate the underlying thesis. The key is to distinguish between noise and signal, which requires a pre-defined framework for what would constitute confirmation or refutation. Without that framework, the investor is left reacting to each new headline rather than evaluating it against a coherent view.
The November 4 session will be remembered for its headline, but its significance lies in what it teaches about how markets process political information. A 3% gain, the largest in 44 years, is a vivid reminder that uncertainty carries a measurable price and that its resolution can release substantial capital. The investor who understands the mechanism, respects the information gaps, and monitors the confirming data is better equipped than one who simply celebrates the number. Markets reward preparation, and the post-election period is a test of exactly that.
From our network :
- Committed Mediterranean Precipitation Decline: Why Emissions Cuts Alone Cannot Restore Winter RainsNew NOAA research reveals that Mediterranean winter rains may decline irreversibly even with emissions cuts. Explore the science of committed climate change and regional impacts.
- University Language Proficiency Exams: Why Institutional Tests Demand Different Preparation Than IELTS and TOEFLDiscover why university-specific language proficiency examinations differ fundamentally from IELTS and TOEFL, and learn strategic preparation approaches for institutional assessment success.
- The Final Descent: How ESA Retired the Legendary Cluster Constellation After 24 Years of Space Weather ScienceAfter 24 years mapping Earth’s magnetosphere, ESA’s Cluster mission concluded with a precisely controlled reentry over the South Pacific. This analysis explores the scientific legacy, engineering decisions, and debris mitigation principles behind one of space exploration’s most responsible retirements.
- The Hidden Cost of AI Convenience: Why Over-Permissioned Agents Are a Security Time BombDiscover why AI agents with excessive permissions create dangerous single points of failure, and learn how implementing least privilege principles can protect your organization from exploitation.
- CISA’s Ten-Advisory Wave: Why Generic Patching Fails in OT and How to Build Product-Specific PlaybooksCISA released ten ICS advisories in one week, exposing critical infrastructure risks. Generic patching fails in OT. Learn to build product-specific remediation playbooks.
- Forbidden Matrix Patterns and Visible Lattice Points: A Geometric DictionaryExplore how multidimensional 0–1 matrices encode geometric truths, linking forbidden patterns to visible lattice points and hypergraph theory, with applications in combinatorics and computational geometry.
- Live Online English Classes for Kids: Do They Actually Reduce Anxiety?A ten-week study reveals that synchronous online English classes can significantly reduce child language anxiety while improving listening and reading skills. Discover what makes these programs effective and how parents can select the right one.
- Mobile Learning and VR in English: What Global Evidence Reveals About Effective Language TechnologyA systematic review across 14 countries reveals which language-learning technologies genuinely work. Mobile learning, AI, and VR show measurable benefits when pedagogically integrated. This evidence-based guide helps educators and learners select technology that delivers real return on investment.
- How AI Agents Will Change the Way We Manage Personal FinancesExplore how AI agents are transforming personal finance through automated budgeting, bill payment, and investment management, while examining the critical security protocols and governance frameworks required for safe deployment.
RESOURCES
- How midterm elections affect the stock market | U.S. Bankusbank.comOct 28, 2026 ... Historical analysis of stock market performance before and after midterm elections shows varying effects.
- Stock market after midterm elections: S&P 500 history - CNBCcnbc.com3 days ago ... According to a CNBC analysis of S&P 500 returns after elections from 1980 through 2024, the index rose an average…
- How might midterm elections impact the stock market? | Fidelityfidelity.comWhat should investors consider before and after a midterm election? · Review your financial goals. · Reassess your risk tolerance. · Rebalance if allocations…
- S&P 500 and Dow surge in best rally after midterm elections ... - CNBCcnbc.comNov 6, 2018 ... The Dow Jones Industrial Average closed up 545 points ... Global Business and Financial News, Stock Quotes, and Market Data…
- Stock Market Today, Nov. 4: Dow Surges 3% in Biggest Post ...finance.yahoo.com10 hours ago ... Wall Street surged following the midterm elections, with the Dow posting its strongest post-election rally in decades as oil prices ...
- Midterm Elections and Stock Market Trends - BlackRockblackrock.comOct 1, 2026 ... Our analysis shows that investors who would have moved their money out of the market ... Historically, the market started…
- Google Finance - Stock Market Prices, Real-time Quotes & Business ...google.comDecisive Midterm Elections Spark Massive Stock Market Rally. Charles Schwab ... Dow Posts Biggest Post-Midterm Rally in 44 Years as Trump Celebrates US ...
- How do markets perform post-midterms?am.jpmorgan.comOct 7, 2026 ... Browse our Weekly Market Recap for a summary of the latest U.S. stock market headlines and insights, including an update…
- Stock-Market Gains Are Weakest After Midterm Results Like Thesebloomberg.com18 hours ago ... While US midterm election results historically bode well for stocks regardless of which party wins, some Wall Street strategists are…
- Investors banking on a stock market rally after midterms should take ...marketwatch.comOct 1, 2018 ... 27. Maybe early voting isn't just for elections. One prominent Wall Street analyst says the stock market may have already…
- Yardeni Research | Independent Financial Research & Analysisyardeni.comThe Dow surged 3.0% today, the strongest post-midterm rally since 1982. The ... Stock Market233 · Week Ahead165 · Employment134 · S&P 500121 ·…
- Trump appears to take credit for stock market rally day after multiple ...wect.com10 hours ago ... President Donald Trump took to social media on Wednesday to praise the sudden rise in stock prices a day after…
- Stocks Soar After Midterm Elections | Nov. 4 Review & Previewbarrons.com7 hours ago ... The Dow Jones Industrial Average surged 3%, or more than 1,500 points today, the biggest post-midterm rally since 1982. The…
- Stock market after midterms: S&P 500 returns since 1950 - Quartzqz.com17 hours ago ... The stock market after midterm elections has a consistent record, with the S&P 500 rising in the 12 months after…
- Most of the U.S. stock market is rallying as Wall Street tries to sort the ...facebook.com14 hours ago ... http: //theonedave.tumblr.com/post/179865596082/post- midterm-rally-in-us-stocks-would-follow-a · No photo description available. Kenneth ...
- 01
- 02
- 03
- 04
- 05
- 06
- 07
- 08
0 Comments