When American voters cast their ballots on a Tuesday in early November, the verdict rarely stays confined to the ballot box. By the following morning, the world's largest equity market had delivered its own verdict, and it was emphatically bullish. The Dow Jones Industrial Average surged roughly 1,500 points in a single session, one of the largest point gains in the index's long history, while crude oil prices moved in the opposite direction and fell sharply. The pairing of rising equities and falling energy costs is a familiar post-election signature, yet each occurrence carries its own distinct set of causes, and the wire report that captured this moment was notably restrained about what those causes were.
That restraint is itself instructive. Markets are often described as voting machines in the short run and weighing machines in the long run, and the immediate aftermath of a midterm election compresses both functions into a few frantic hours of trading. Investors were not merely celebrating a partisan outcome; they were repricing uncertainty itself. When a contested political calendar resolves into a known configuration, portfolios that had been hedged against ambiguity can be rebalanced toward risk, and the resulting bid lifts the broad indices. Oil's decline tells a parallel story, one in which demand expectations, dollar strength, and the removal of a geopolitical risk premium all compete for explanatory primacy.
What follows examines the anatomy of that single trading day and the deeper machinery beneath it. The analysis separates correlation from causation, weighs the historical record of post-midterm rallies, and considers why energy markets so frequently move inversely to equities at moments of political clarity. It also confronts the honest limits of the source material, which reported the moves without assigning reasons or naming a winning party, and treats that omission not as a flaw but as a prompt for rigorous inquiry. Readers seeking a tidy narrative will find instead a disciplined map of the forces that actually move prices.
On This Page
- The Anatomy of a Post-Election Trading Session
- Oil's Inverse Move and the Energy-Equity Relationship
- Midterm Elections and the Repricing of Political Uncertainty
- Media Framing and the Limits of Financial Reporting
- Portfolio Implications and the Discipline of Interpretation
- Conclusion: Reading the Market's Verdict with Precision
TL;DR A sharp post-midterm rally lifted the Dow Jones Industrial Average by approximately 1,500 points while oil prices fell, a twin move that reflects the repricing of political uncertainty rather than a simple partisan verdict. Equity markets reward the removal of ambiguity, and energy markets respond to demand expectations, currency dynamics, and the unwinding of risk premiums. The original report documented the moves without explaining them or identifying the election's outcome, which makes the episode a useful case study in how markets process information, how journalists frame financial news, and why single-day point gains demand contextual interpretation rather than breathless celebration.
The Anatomy of a Post-Election Trading Session
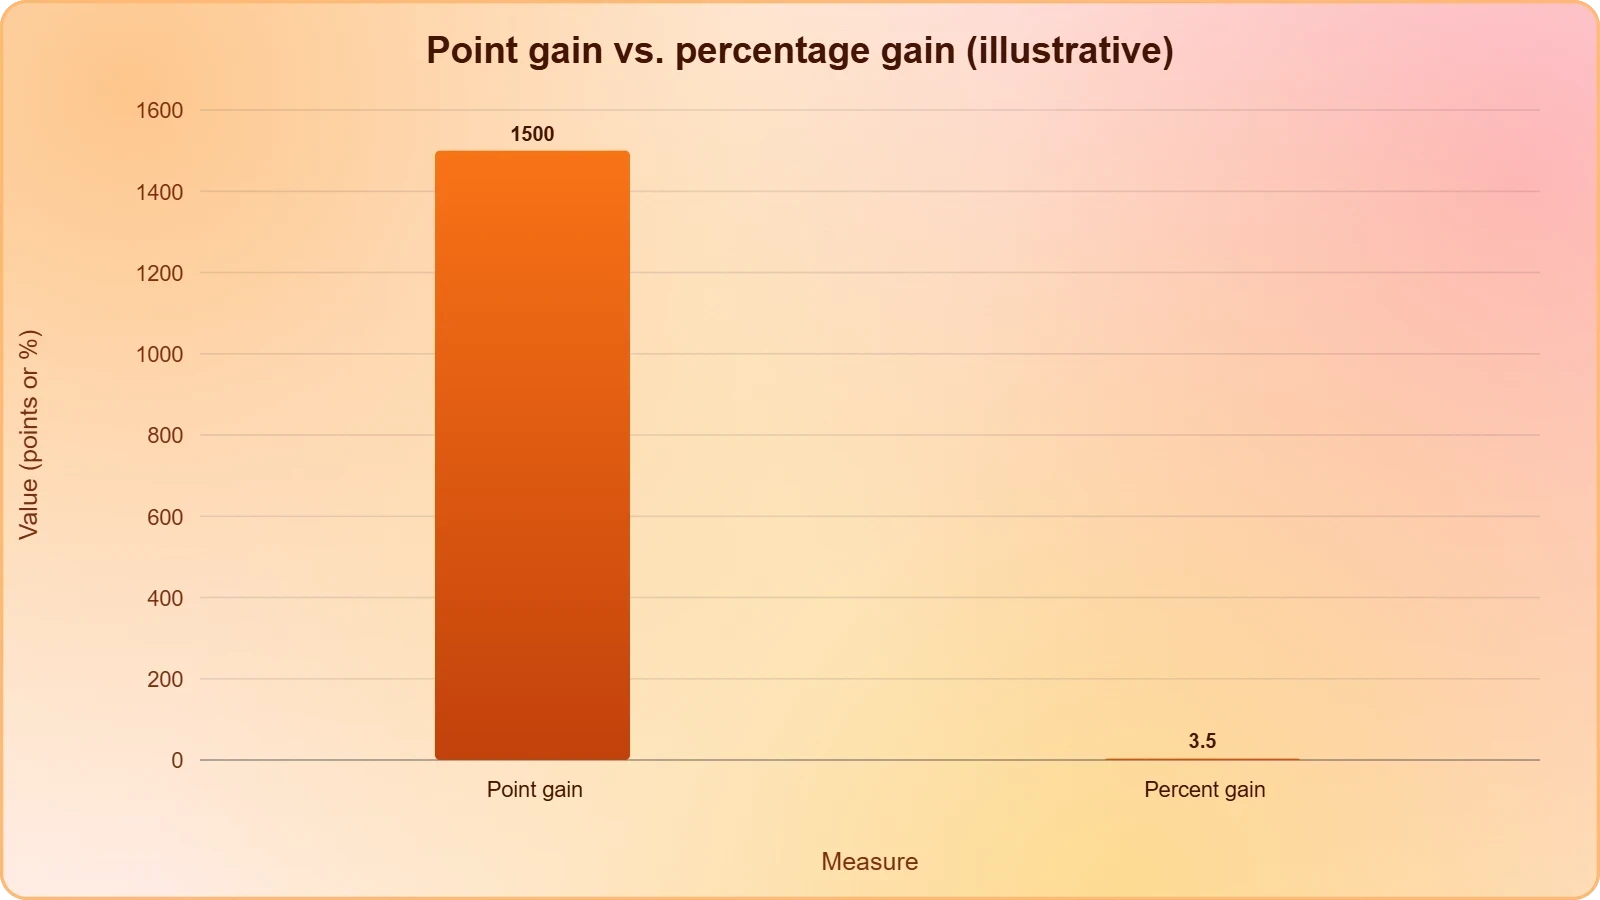
A 1,500-point move in the Dow is the kind of number that dominates headlines precisely because it is rare and visually arresting. Yet point gains are a poor unit of measurement for market significance, since the index's absolute level has risen enormously over decades, meaning identical percentage moves now produce far larger point figures than they once did. The more meaningful question is what the session revealed about positioning, liquidity, and the collective psychology of institutional investors who had spent weeks building hedges against electoral surprises. When those hedges are unwound, the mechanical buying that follows can amplify a move well beyond what fundamentals alone would justify.
Reading the Point Gain in Context
Percentage change, not point change, is the analyst's proper lens. A 1,500-point advance on an index trading above forty thousand represents a gain in the neighborhood of three to four percent, which is substantial but hardly unprecedented. Historical data on post-midterm sessions shows a persistent tendency toward positive returns, a pattern often attributed to the resolution of uncertainty and the frequency with which midterm outcomes produce divided government. Divided government, counterintuitively, is frequently welcomed by markets because it constrains the scope of legislative change, reducing the risk of disruptive regulation or abrupt fiscal shifts that could unsettle earnings expectations.
The composition of the rally matters as much as its magnitude. Broad-based advances, in which most sectors participate, signal genuine risk appetite, whereas narrow rallies concentrated in a handful of mega-cap technology names can mask underlying weakness. The source report references artificial intelligence earnings in its underlying article context, hinting that corporate results were interwoven with the political catalyst. When earnings momentum and political clarity arrive in the same week, the market's reaction becomes a composite of both forces, and disentangling them requires attention to sector-level dispersion rather than a single headline index figure.
Why the Report Withheld Attribution
Financial wire reporting operates under a discipline that rewards verifiable fact over interpretive flourish. Stating that the Dow rose 1,500 points and oil fell is defensible; asserting that the rally occurred because one party prevailed requires evidence the reporter may not have possessed at the moment of filing. This restraint protects readers from the most seductive error in market commentary, which is the retroactive invention of a clean causal story for a messy, multi-variable outcome. The absence of attribution is therefore a feature of responsible journalism, not a gap to be filled with speculation dressed as analysis.
That said, the omission leaves the curious reader with work to do. Markets process information through the aggregated expectations of millions of participants, and those expectations are shaped by polling, prediction markets, sector exposure, and tax positioning long before any ballot is counted. The Wednesday session was the visible tip of a repricing process that had been underway for weeks. Understanding it requires reconstructing the pre-election hedging landscape and recognizing that the rally represented the release of tension rather than the arrival of new fundamental information about corporate profits or economic growth.
We Also Published
Oil's Inverse Move and the Energy-Equity Relationship
The simultaneous decline in crude prices is the detail that transforms a routine equity rally into an interesting puzzle. Equities and oil frequently move together when a shared demand signal drives both, yet they diverge when the forces at play are political, currency-driven, or supply-specific. A falling oil price can signal weakening global demand, which would ordinarily pressure equities, so the fact that stocks rose while crude fell suggests the dominant driver was not demand pessimism but something else entirely, perhaps a stronger dollar, an easing of supply fears, or the unwinding of a geopolitical risk premium embedded in energy futures.
Demand Signals Versus Risk Premiums
Crude oil carries a risk premium whenever supply disruptions appear plausible, whether from conflict, sanctions, or infrastructure failure. When political uncertainty resolves, that premium can compress rapidly, sending futures lower even as the broader economic outlook remains stable. This mechanism explains why energy often sells off after elections regardless of which party wins: the market is not pricing policy preference but the removal of a tail risk. Distinguishing between a demand-driven decline and a premium-driven decline is essential, because the former is bearish for equities over time while the latter is frequently benign or even constructive.
The dollar adds another layer. Oil is priced in dollars globally, so a strengthening currency mechanically lowers the dollar cost of crude for foreign buyers and tends to depress nominal prices. Post-election sessions often feature dollar strength as capital flows toward American assets, reinforcing the inverse relationship between the currency and commodities. Investors watching the energy-equity divergence should therefore monitor the dollar index alongside inventories and OPEC signals, since the currency channel can dominate short-term price action even when physical supply and demand are unchanged.
The Historical Pattern of Divergence
Energy and equity markets have diverged after major political events many times, and the pattern tends to resolve within weeks as fundamental data reasserts itself. What matters for portfolio construction is not the single session but the persistence of the relationship. If oil continues to fall while equities climb, the implication is disinflationary and supportive of valuations, particularly for consumer-facing sectors that benefit from lower fuel costs. If the divergence reverses and both fall together, the signal shifts toward demand weakness and warrants defensive positioning.
Commodity traders also watch the shape of the futures curve, since a move from backwardation to contango can signal shifting expectations about near-term scarcity. A post-election selloff that flattens the curve suggests the market is revising supply expectations rather than merely reacting to headlines. These structural signals are far more informative than the daily price change, and they reward investors who look past the drama of a single Wednesday to the quieter mechanics of storage, shipping, and refinery margins that ultimately determine where crude trades over the following quarter.
Midterm Elections and the Repricing of Political Uncertainty
Political uncertainty is a cost that markets pay continuously, embedded in volatility premiums, option pricing, and the discount rates applied to regulated industries. Midterm elections concentrate that cost into a single date, and the day after the vote frequently produces a relief rally as the accumulated premium is released. This mechanism operates largely independently of which party wins, because the market's primary preference is for a known environment in which capital allocation decisions can proceed without the paralysis that ambiguity induces. The rally is thus a vote for clarity as much as for any particular policy platform.
Divided Government as a Market Preference
Gridlock has an underappreciated appeal to investors. When control of Congress is split, the probability of sweeping legislative change declines, and with it the risk of abrupt shifts in taxation, regulation, or industrial policy. Sectors that had priced in adverse outcomes can recover, and the broad index benefits from the reduction in tail risk. This is why midterm results that produce divided government are frequently followed by gains, and why unified control sometimes produces more muted or even negative reactions despite the apparent mandate it represents.
The source report's silence on which party won is therefore less consequential than it first appears. The market's reaction was likely driven by the resolution of uncertainty rather than the identity of the victor, and the same rally might have occurred under either outcome provided the result was clear enough to end speculation. Analysts who insist on partisan explanations risk missing the deeper structural truth: markets trade probabilities, and the transition from a probability distribution to a known state is itself the event that moves prices.
Volatility, Hedging, and the Release of Tension
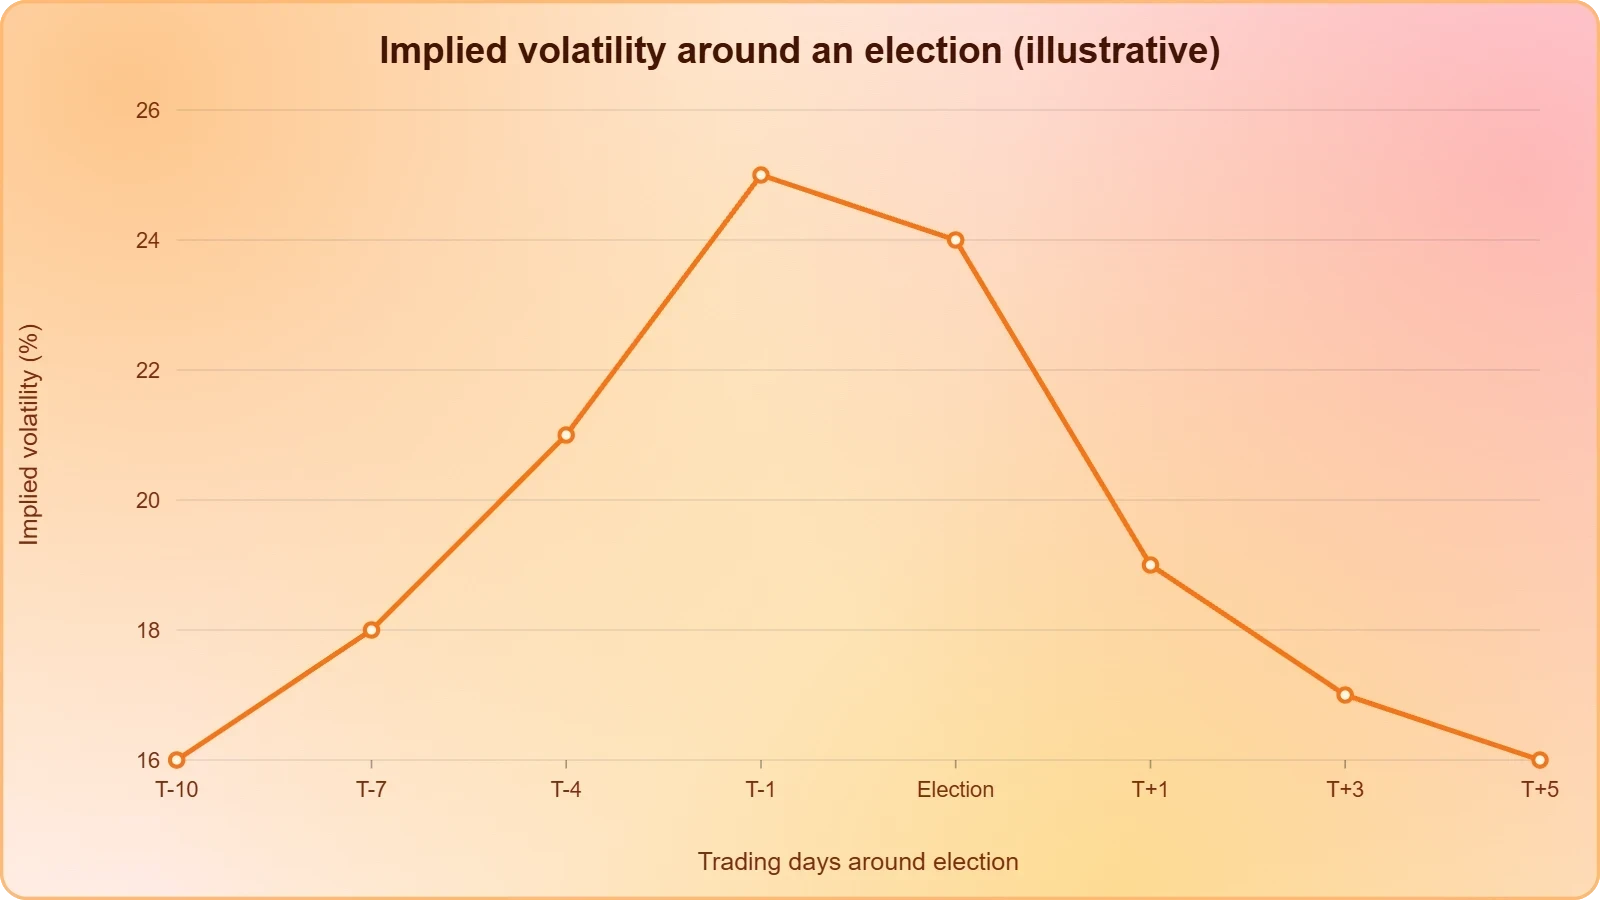
Implied volatility typically rises into elections as investors purchase protection against adverse outcomes. Once the event passes, those hedges expire or are closed, and the associated premium deflates. This mechanical process can produce outsized index moves that have little to do with any change in expected corporate earnings. Understanding the volatility cycle is essential for interpreting post-election sessions correctly, because a rally driven by hedge unwinding may partially reverse once the technical flows subside, whereas a rally driven by genuine fundamental reassessment tends to persist.
The practical lesson for investors is to distinguish between the event and the regime. The election was an event, discrete and dated; the policy environment it produces is a regime that unfolds over years. Markets often conflate the two, celebrating the end of a campaign as though it were the end of uncertainty itself. Prudent portfolio management treats post-election rallies as opportunities to reassess positioning rather than as confirmations of a durable trend, since the forces that drive returns over the following twelve months are earnings, interest rates, and productivity, not the ballot count.
- 01
- 02
- 03
- 04
Media Framing and the Limits of Financial Reporting
The wire report that documented this session exemplifies a particular style of financial journalism: factual, compressed, and deliberately agnostic about causation. It reported the Dow's gain, the oil decline, and the timing of the election, then stopped. For readers accustomed to explanatory journalism, the absence of a why can feel unsatisfying, yet the discipline of withholding unverified causal claims is precisely what separates reliable reporting from speculation. The report's value lies in what it establishes as fact, leaving interpretation to analysts equipped with models and data.
What Headlines Emphasize and Omit
Headlines gravitate toward large round numbers because they are legible and dramatic, which is why 1,500 points received prominence over the percentage change that would have provided better context. This framing bias shapes public perception of market events, encouraging retail investors to interpret point moves as more significant than they are. A more informative headline might have led with the percentage gain, the sector breadth, or the bond market's reaction, each of which conveys more about the underlying economic signal than the raw index arithmetic.
The omission of the election outcome is equally telling. By declining to name a winner, the report avoided the temptation to construct a partisan narrative around a move that may have had little to do with partisanship. This restraint is increasingly rare in a media environment that rewards engagement over accuracy, and it serves as a reminder that the most useful financial reporting often answers the question of what happened while explicitly declining to assert why until the evidence supports it.
Building Financial Literacy from Sparse Reports
Sparse reports are excellent training material for financial literacy because they force readers to supply the missing analytical scaffolding. A reader who encounters a 1,500-point headline and immediately asks about percentage change, sector participation, bond yields, and currency moves is practicing the habits of a disciplined investor. Over time, this reflex transforms passive news consumption into active market education, and the reader develops the capacity to distinguish signal from noise even when the underlying report offers only the barest factual outline.
Educational institutions and financial media alike could do more to cultivate this reflex. Explaining why point gains mislead, how oil and equities interact, and what divided government implies for policy risk would equip audiences to interpret future sessions independently. The goal is not to turn every reader into a trader but to foster a public capable of evaluating economic news critically, resistant to sensational framing, and equipped to recognize that the most important information often lies in what a report declines to claim.
Portfolio Implications and the Discipline of Interpretation
For investors, the practical question is how to respond to sessions like this one without overreacting. The disciplined answer begins with recognizing that a single day's move, however dramatic, rarely justifies a strategic shift. Portfolios are built around time horizons measured in years, and the appropriate response to a post-election rally is to review whether the underlying assumptions still hold, not to chase the momentum. Rebalancing toward target allocations, trimming positions that have run ahead of fundamentals, and confirming that risk exposure matches tolerance are the constructive actions available.
Positioning Across Sectors After a Political Event
Sector rotation frequently follows elections as investors reassess which industries face friendlier regulatory and fiscal conditions. Energy, healthcare, financials, and industrials each carry distinct policy sensitivities, and the resolution of electoral uncertainty allows those sensitivities to be repriced. A falling oil price, for instance, benefits transport and consumer discretionary firms while pressuring energy producers, creating relative-value opportunities for investors willing to look through the index-level noise to the underlying earnings implications of cheaper fuel and shifting regulation.
Currency and rate exposures deserve equal attention. Post-election dollar strength affects multinational earnings translations, and shifts in the yield curve signal changing expectations about growth and inflation. Investors holding international assets should consider whether the political clarity that lifted American equities also alters the relative attractiveness of foreign markets, since capital flows responding to a single country's political resolution can create dislocations elsewhere. These second-order effects are frequently more consequential for diversified portfolios than the headline index move itself.
Separating Signal from Noise in Single-Day Moves
The most durable skill in investing is the ability to distinguish a meaningful signal from a transient fluctuation. A 1,500-point rally accompanied by falling oil and a clear electoral outcome contains genuine information about risk appetite and policy expectations, but it also contains noise from hedge unwinding, index rebalancing, and algorithmic momentum. Separating the two requires patience, since the signal becomes visible only over subsequent sessions as prices either hold or retrace. Investors who act decisively on day one frequently mistake the noise for the signal and pay for the error.
A useful discipline is to write down the thesis before acting and then test it against the following week's data. If the rally was driven by uncertainty resolution, volatility should remain subdued and breadth should stay healthy. If it was driven by technical flows, the gains may fade as those flows exhaust themselves. This simple practice of pre-committing to falsifiable expectations transforms market commentary from entertainment into a feedback loop that gradually improves judgment, and it protects capital from the seductive pull of dramatic headlines.
Conclusion: Reading the Market's Verdict with Precision
The session that lifted the Dow by roughly 1,500 points while oil fell was a textbook demonstration of how markets process political information. The rally reflected the release of accumulated uncertainty, the unwinding of hedges, and the reassessment of policy risk, all occurring within hours of the ballots being counted. Oil's decline added a second layer, one shaped by currency dynamics, risk-premium compression, and shifting supply expectations. None of these forces required a partisan explanation, and the report's refusal to supply one was a mark of professional integrity rather than a gap in understanding.
What remains is the enduring lesson about interpretation. Financial markets are information-processing systems that convert probabilities into prices, and the most dramatic sessions are often those in which a large block of uncertainty resolves at once. Investors who understand this mechanism can read post-election rallies with appropriate calibration, neither dismissing them as meaningless nor inflating them into prophecies. The discipline lies in asking the right questions about breadth, percentage change, currency effects, and sector rotation, and in resisting the temptation to retrofit a tidy narrative onto a complex and multi-causal event.
From our network :
- Committed Mediterranean Precipitation Decline: Why Emissions Cuts Alone Cannot Restore Winter RainsNew NOAA research reveals that Mediterranean winter rains may decline irreversibly even with emissions cuts. Explore the science of committed climate change and regional impacts.
- Live Online English Classes for Kids: Do They Actually Reduce Anxiety?A ten-week study reveals that synchronous online English classes can significantly reduce child language anxiety while improving listening and reading skills. Discover what makes these programs effective and how parents can select the right one.
- CISA’s Ten-Advisory Wave: Why Generic Patching Fails in OT and How to Build Product-Specific PlaybooksCISA released ten ICS advisories in one week, exposing critical infrastructure risks. Generic patching fails in OT. Learn to build product-specific remediation playbooks.
- The Hidden Cost of AI Convenience: Why Over-Permissioned Agents Are a Security Time BombDiscover why AI agents with excessive permissions create dangerous single points of failure, and learn how implementing least privilege principles can protect your organization from exploitation.
- Forbidden Matrix Patterns and Visible Lattice Points: A Geometric DictionaryExplore how multidimensional 0–1 matrices encode geometric truths, linking forbidden patterns to visible lattice points and hypergraph theory, with applications in combinatorics and computational geometry.
- University Language Proficiency Exams: Why Institutional Tests Demand Different Preparation Than IELTS and TOEFLDiscover why university-specific language proficiency examinations differ fundamentally from IELTS and TOEFL, and learn strategic preparation approaches for institutional assessment success.
- How AI Agents Will Change the Way We Manage Personal FinancesExplore how AI agents are transforming personal finance through automated budgeting, bill payment, and investment management, while examining the critical security protocols and governance frameworks required for safe deployment.
- Mobile Learning and VR in English: What Global Evidence Reveals About Effective Language TechnologyA systematic review across 14 countries reveals which language-learning technologies genuinely work. Mobile learning, AI, and VR show measurable benefits when pedagogically integrated. This evidence-based guide helps educators and learners select technology that delivers real return on investment.
- The Final Descent: How ESA Retired the Legendary Cluster Constellation After 24 Years of Space Weather ScienceAfter 24 years mapping Earth’s magnetosphere, ESA’s Cluster mission concluded with a precisely controlled reentry over the South Pacific. This analysis explores the scientific legacy, engineering decisions, and debris mitigation principles behind one of space exploration’s most responsible retirements.
RESOURCES
- Stock market news for Nov. 4, 2026 - CNBCcnbc.com10 hours ago ... Stocks ripped higher on Wednesday after a decisive victory by Democrats in the U.S. midterm elections removed political risk that…
- US stocks rally but Tesla's falls after Democrats win big in midtermsapnews.com10 hours ago ... Stocks surge, and the Dow soars 1,500 points as oil prices tumble following the US midterm elections ... market, Treasury…
- Wall Street ends higher after Democrats win Congress; data center ...reuters.com8 hours ago ... Wall Street closed sharply higher on Wednesday as Democrats' sweeping midterm election victory eased political uncertainty and boosted risk ...
- US stock markets and government bonds rally while dollar falls after ...theguardian.com1 day ago ... European shares also power ahead as markets react to blue wave in US midterm elections.
- Stocks rally worldwide and oil prices ease on the hopes for a ... - PBSpbs.orgApr 1, 2026 ... Oil prices also fell back toward $100 per barrel after President Donald Trump said late Tuesday that the U.S. military…
- How might midterm elections impact the stock market? | Fidelityfidelity.com2026 returns so far have strayed from historical patterns, with stocks showing strength despite concerns about higher oil prices, AI spending, and interest ...
- Oil prices rise and stocks give back part of record-breaking rally ...pbs.orgApr 20, 2026 ... Oil prices are climbing following the latest rise of U.S.-Iran tensions, but the moves are more modest than they were…
- Oil price falls and markets rally after Trump says Iran war over in 'two ...theguardian.comApr 1, 2026 ... US president's claim that conflict is nearing end prompts 15% drop in Brent crude and stock market climb in Asia.
- Stock market today: Dow, S&P 500, Nasdaq rally to cap volatile ...finance.yahoo.comOct 9, 2026 ... Oil prices retreated after President Trump said the US would not attack Iran before next month's midterm elections, easing some…
- Most of the U.S. stock market is rallying as Wall Street tries to sort the ...facebook.com14 hours ago ... ⭕ Midterm Elections And Stock Market History The record books usually offer hope for investors. ... oil prices. Another reason…
- Stock market today: Dow slips, Nasdaq posts fresh record with AI ...finance.yahoo.comSep 22, 2026 ... US stocks steadied on Tuesday after confidence in artificial intelligence and falling oil prices spurred a rally on Wall Street.
- Stocks, Bonds Climb After US Election as Oil Sinks: Markets Wrapbloomberg.com10 hours ago ... A Democratic sweep of Congress that highlighted opposition of the Iran war extended this week's plunge in oil prices, helping…
- Wall Street surges after US midterms as oil prices tumble - CommBankcommbank.com.au9 hours ago ... US stocks surged after the midterm elections ended Republican control of Congress, while oil prices tumbled and Treasury bond yields…
- US stocks surge, Dow soars 1500 points as Brent oil's price ... - KCBDkcbd.com19 hours ago ... U.S. stocks are rallying after President Donald Trump's party lost its sole control of Washington in the midterm elections.
- 01
- 02
- 03
- 04
- 05
- 06
- 07
- 08
0 Comments