
Australia's housing finance market has just recorded one of the most abrupt contractions in its modern statistical history, and the September quarter figures released by the Australian Bureau of Statistics deserve careful reading rather than reflexive headlines. The total number of new home loans fell 15 per cent between June and September, while the aggregate value of those loans dropped 16 per cent — a twin decline that signals genuine withdrawal rather than a simple reshuffling of buyer types. What makes this episode analytically distinctive is not merely the scale of the fall but its composition: investor lending collapsed by 31 per cent, owner-occupier borrowing slipped a comparatively modest 5 per cent, and both movements set records for the series.
Behind those numbers sits a collision of forces that rarely align so precisely. The Reserve Bank of Australia has lifted rates five times across the year, pushing the cash rate to its highest level since 2008, which by itself would normally cool credit demand gradually. Layered on top are federal tax changes announced in the May budget to curb breaks for property investors, alongside a widely shared expectation that prices are heading lower. When borrowing costs, tax treatment and price psychology move in the same direction simultaneously, the result is a financing shock that compounds rather than accumulates, and the data suggest exactly that dynamic is now working through the system.
The political and social dimensions are equally instructive. Housing Minister Clare O'Neil framed the decline as evidence of a market rebalancing away from investors and toward first home buyers, while the opposition and property industry groups attributed the slump to the negative gearing and capital gains tax adjustments. Nationwide house prices have fallen 6.7 per cent from their March peak — the fastest decline in four decades according to property data firm Cotality — and auction clearance rates have softened in tandem. Treasury's structural forecast of a modest two-percentage-point drag on price growth now looks optimistic even in private government assessments, which raises pointed questions about how policy calibration is communicated to households and lenders alike.
On This Page
TL;DR Australia's September quarter housing finance data reveal a record 15 per cent fall in new home loans and a 16 per cent drop in total loan value, driven overwhelmingly by a 31 per cent collapse in investor borrowing. Five Reserve Bank rate rises, federal tax changes to negative gearing and capital gains concessions, and expectations of falling prices combined to produce the sharpest credit contraction on record. Owner-occupier lending fell only 5 per cent, suggesting the policy intent of shifting demand toward first home buyers is partially working, but nationwide prices are down 6.7 per cent from their March peak — the fastest decline in forty years — and Treasury's modest forecast now appears too optimistic.
The Anatomy of a Record Lending Contraction
The September quarter result is best understood as a stress test of how quickly a credit market can reprice when several levers are pulled at once. A 15 per cent quarterly fall in loan counts is extraordinary in a series that typically moves in single digits, and the 16 per cent value decline implies the average loan size also shrank slightly, meaning the contraction was not confined to marginal borrowers at the top of the market. Statisticians at the bureau were careful to note that both the headline fall and the investor-specific fall were the largest ever recorded, which places this episode outside the normal range of cyclical cooling and into the territory of structural adjustment.
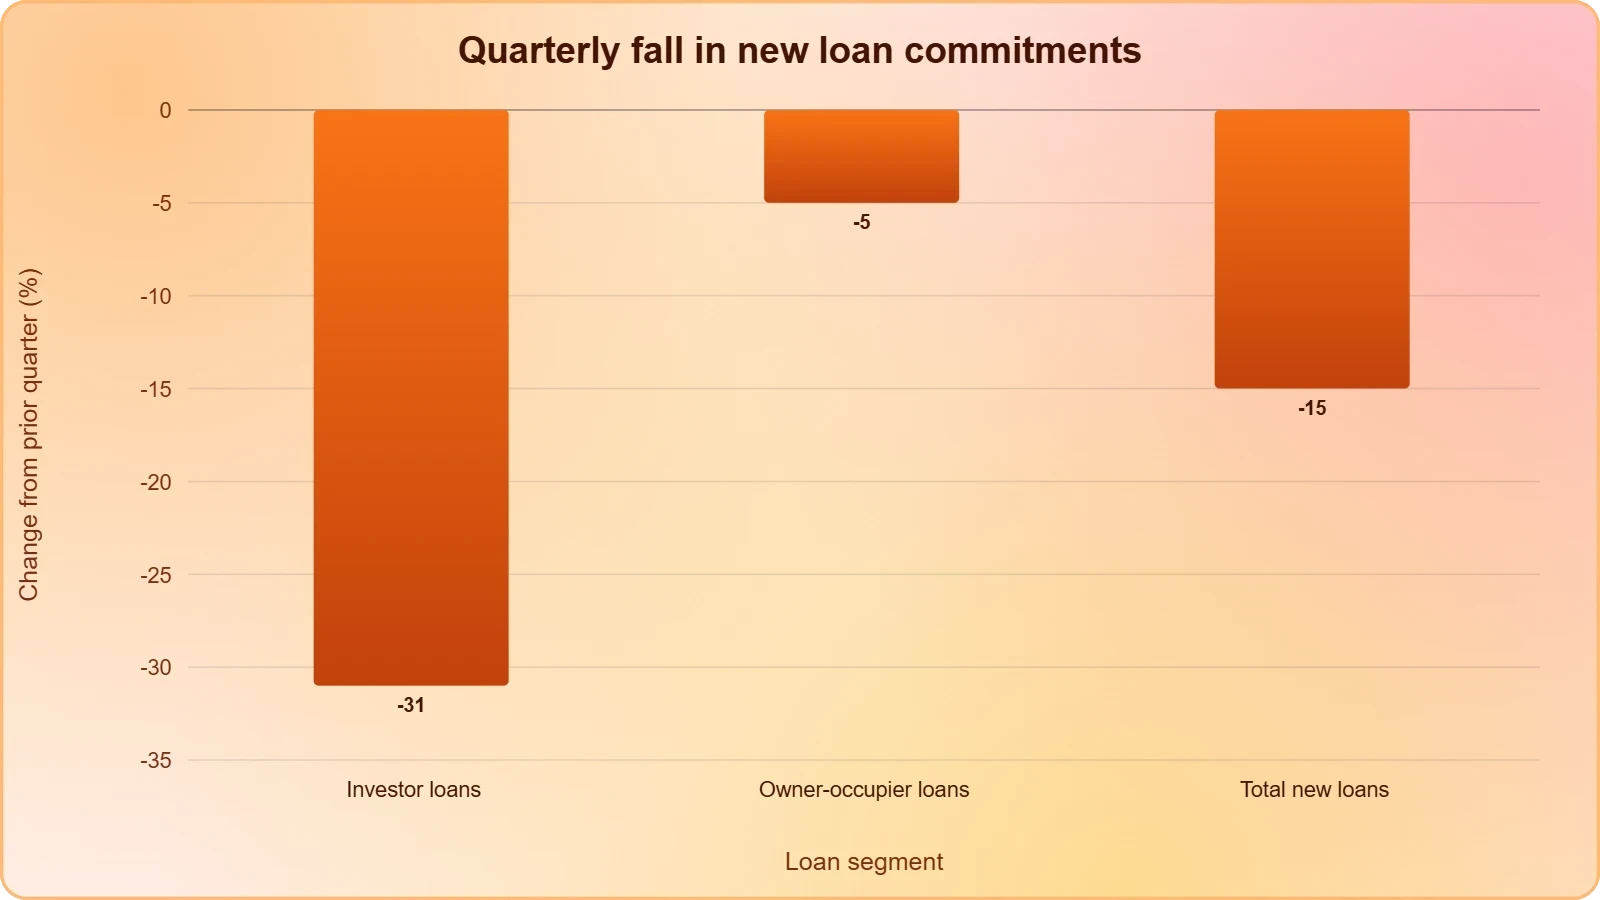
What distinguishes this from previous tightening cycles is the speed of transmission. Historically, rate rises work through housing credit with a lag of two to three quarters as existing approvals are drawn down and borrowers adjust expectations. Here, the tax announcement appears to have acted as an accelerant, front-loading behavioural change that would otherwise have unfolded slowly. Investors who had been weighing marginal purchases suddenly faced a different after-tax return calculation, and many simply stepped back rather than reprice their bids, producing the abrupt 31 per cent withdrawal that now dominates the statistical narrative.
Reading the Investor Withdrawal in Context
Investor lending is the most sentiment-sensitive component of housing finance because it is discretionary by nature. An owner-occupier buying a home to live in is motivated by shelter, family formation and schooling catchments — considerations that persist through rate cycles. An investor, by contrast, is running a return comparison against term deposits, equities and other assets, and small changes in expected after-tax yield can tip the decision decisively. A 31 per cent quarterly fall therefore tells us less about affordability for households and more about the marginal attractiveness of residential property as a leveraged investment vehicle under the new settings.
Mish Tan, head of finance statistics at the bureau, attributed the shift to a combination of high interest rates, the tax changes and expectations of lower house prices. That triad matters because each element reinforces the others: higher rates raise holding costs, tax changes reduce net returns, and expected price declines remove the capital gains component that often justified thin rental yields. When all three deteriorate together, the rational investor response is to defer, and deferral at scale produces precisely the kind of record decline now visible in the quarterly aggregates.
Owner-Occupiers and the First Home Buyer Signal
The 5 per cent decline in owner-occupier lending is the quieter but arguably more policy-relevant number. It suggests that households buying homes to live in remained substantially engaged even as investors fled, which is consistent with the government's stated objective of rebalancing the market toward genuine occupiers. Housing Minister Clare O'Neil welcomed the figures on exactly this basis, arguing they demonstrated a shift away from investors and toward people buying homes to live in, particularly first home buyers entering the market for the first time.
Whether that rebalancing translates into improved affordability is a separate and harder question. Reduced investor competition at auctions can ease the bidding pressure that first home buyers face, and softer clearance rates give purchasers more negotiating room. But if credit availability tightens broadly and prices fall, first home buyers also face the risk of buying into a declining market, and lenders may become more conservative in assessing serviceability. The net welfare effect therefore depends on how long the adjustment lasts and whether supply responds, neither of which can be read directly from a single quarter of finance data.
We Also Published
Interest Rates, Tax Policy and the Psychology of Price Expectations
Monetary policy has done much of the heavy lifting in this contraction, but it has not acted alone. Five rate rises across the year have taken the cash rate to its highest level since 2008, materially raising the cost of servicing both new and existing mortgages. For an investor running a leveraged position, each increment in the cash rate flows directly into interest expense, compressing the spread between rental yield and funding cost. Reserve Bank governor Michele Bullock observed that investor demand had fallen much further than in earlier periods of rate rises, which she suggested pointed to the tax changes also having a material effect on behaviour.
That observation is analytically important because it separates this cycle from the orthodox transmission mechanism. In a pure rate-driven slowdown, investor and owner-occupier lending tend to decline together, with investors falling somewhat more because of their greater sensitivity to financing costs. Here the divergence between a 31 per cent investor decline and a 5 per cent owner-occupier decline is too wide to be explained by interest rates alone, implying that the tax treatment of investment property has become a first-order determinant of credit demand rather than a secondary consideration.
What the Tax Changes Actually Alter
The federal budget measures target two long-standing features of the Australian tax system: negative gearing, which allows investors to deduct losses on rental properties against other income, and the capital gains tax discount, which reduces the tax payable on gains from assets held over a year. Both provisions have historically improved the after-tax return on residential investment, and both have been politically contested for decades. Curtailing them changes the arithmetic of a leveraged purchase at the margin, particularly for investors relying on capital growth rather than rental yield to generate returns.
The timing of the announcement matters as much as its content. Because the changes were announced in May with implementation to follow, investors had a window in which to reassess their positions before the new settings fully applied. Some deferred purchases, others reviewed portfolios, and the aggregate effect showed up in the September quarter as a sharp step-down rather than a gradual glide path. Policy announcements that alter expected after-tax returns tend to move behaviour before they move cash flows, and this episode is a textbook illustration of that principle in a housing finance context.
Price Expectations as a Self-Reinforcing Force
Expectations of lower house prices complete the triad identified by the bureau's statisticians. When buyers believe prices will be lower in six months, the rational response is to wait, and when enough buyers wait, prices do indeed fall, validating the original expectation. This reflexive quality makes housing downturns difficult to arrest once momentum builds, because each price decline reinforces the case for further deferral. Nationwide prices are already down 6.7 per cent from their March peak, the fastest decline in forty years according to Cotality, and auction clearance rates have fallen in parallel, confirming that the expectation channel is now active rather than hypothetical.
The interaction between credit and prices also runs in the opposite direction. Falling prices reduce the collateral value underpinning new loans, which can tighten lending conditions and reduce the maximum amount borrowers can access. That feedback loop is precisely what makes housing corrections self-limiting in some cases and self-reinforcing in others, depending on how lenders respond. If banks maintain appetite and serviceability standards hold, the loop dampens; if lenders become defensive, the contraction in credit can outrun the decline in prices, extending the adjustment well beyond the initial policy shock.
The Political Contest Over Causation
Housing policy in Australia has rarely been free of partisan framing, and the reaction to these figures followed the established script with unusual clarity. Housing Minister Clare O'Neil welcomed the data as evidence that the market was shifting away from investors and toward people buying homes to live in, particularly first home buyers, and described the changes as an attempt to rebalance a market that had favoured investors for a generation. That framing positions the decline as intended and desirable, a correction of a long-standing distortion rather than a policy failure.
The opposition took the opposite view. Liberal housing spokesperson Andrew Bragg argued that confidence in the market had collapsed and pointed out that loans to all buyers were down, not merely investor loans. Property industry groups similarly attributed the contraction to the negative gearing and capital gains tax changes, warning that reduced investor activity would ultimately tighten rental supply. Both narratives contain elements of truth, and the political difficulty is that the data cannot adjudicate between them within a single quarter, because the effects on rents and supply operate over years rather than months.
Rebalancing Versus Confidence Collapse
The government's rebalancing argument rests on the observation that owner-occupier lending held up far better than investor lending, which is consistent with a compositional shift rather than a uniform collapse in demand. If the policy objective was to reduce investor dominance at auctions and give first home buyers a clearer run, a 31 per cent investor decline alongside a 5 per cent owner-occupier decline is roughly the pattern one would hope to see. The counter-argument is that a 15 per cent headline fall is too large to be characterised as surgical rebalancing, and that confidence effects spill across buyer categories regardless of intent.
There is also a distributional question buried in the aggregate figures. Investors are not a homogeneous group: some are large portfolio holders with diversified exposure, while others are small-scale landlords with a single property and limited capacity to absorb higher costs. A sharp withdrawal by the latter group could reduce rental supply in precisely the segments where affordability pressure is greatest, offsetting any benefit to first home buyers from softer purchase prices. The rebalancing narrative is therefore most persuasive at the level of purchase competition and least persuasive at the level of rental availability, and the two effects will need to be tracked separately.
Forecast Credibility and the Treasury Gap
Treasury's pre-announcement analysis predicted a modest two-percentage-point decline in house price growth, explicitly characterised as a structural forecast rather than a short-term projection. The government and Treasury have publicly maintained that forecast even as prices have fallen 6.7 per cent from their March peak, though there is private recognition within government that the decline has been deeper than expected. That gap between public projection and private assessment is a familiar feature of policy communication, but it carries real costs when markets and households begin to discount official forecasts.
Forecast credibility matters because expectations are themselves a transmission channel. If households believe official projections understate the downturn, they may defer purchases more aggressively, accelerating the very decline the forecast sought to characterise as modest. Conversely, a forecast that is seen as realistic can anchor expectations and slow the reflexive dynamic. The challenge for Treasury is that structural forecasts are inherently ill-suited to capturing the interaction between tax changes, rate rises and sentiment, which is precisely the interaction now driving the data.
- 01
- 02
- 03
- 04
Price Dynamics and the Forty-Year Record
The 6.7 per cent decline from the March peak is the fastest in four decades, and that superlative deserves scrutiny rather than acceptance at face value. Australia's housing market has experienced several sharp corrections since the 1980s, but most were either brief or concentrated in specific cities. A nationwide decline of this magnitude within roughly eight months is unusual because it requires simultaneous weakness across multiple capital city markets, which is precisely what the lending data imply. When investor credit contracts by nearly a third in a single quarter, the price effect is unlikely to remain geographically contained.
Auction clearance rates provide a useful real-time complement to the lagging price indices. Clearance rates reflect the balance of bargaining power at the point of sale, and their decline confirms that sellers are losing pricing power rather than merely facing fewer bidders. The combination of falling clearance rates, falling prices and collapsing investor credit describes a market in which the marginal buyer has withdrawn and the remaining participants are negotiating from a stronger position. That configuration tends to persist until either credit conditions ease or prices fall far enough to attract new demand.
Why This Correction Differs From Previous Cycles
Earlier Australian housing downturns were predominantly rate-driven, and their resolution followed a predictable pattern: once the central bank paused or cut, credit demand recovered and prices stabilised. This episode differs because the tax changes are structural rather than cyclical. A rate cut can be reversed within months, but a legislative change to negative gearing and capital gains treatment alters the investment calculus for years, which means the investor segment may not recover on the same timeline as the owner-occupier segment. That asymmetry is the single most important analytical distinction between this correction and its predecessors.
The supply-side response also matters. If reduced investor activity translates into fewer rental properties being built or purchased, rental vacancy rates could tighten over the medium term, pushing rents higher even as purchase prices fall. That combination — softer prices alongside firmer rents — would improve gross rental yields and eventually draw investors back, but only after a lag that could last several years. The market's adjustment path is therefore likely to be longer and more uneven than a conventional rate-driven cycle, with different segments recovering at different speeds.
Implications for Households and Lenders
For households, the practical implications split sharply by tenure. Existing owners face the discomfort of falling valuations, though this only becomes material if they need to sell or refinance. First home buyers gain negotiating room and reduced competition, but must weigh the risk of purchasing into a declining market against the possibility that waiting proves costly if credit conditions ease. Renters face the least immediate benefit and the greatest medium-term risk, since reduced investor purchasing could constrain rental supply precisely when population growth is adding to demand.
For lenders, the contraction raises questions about credit appetite and provisioning. A 31 per cent fall in investor lending reduces exposure to a segment that is more sensitive to rate and tax changes, which is prudent from a risk perspective but also reduces interest income. If owner-occupier lending continues to hold up, banks can rebalance their books toward lower-risk mortgages, but they will also be watching serviceability metrics closely as prices fall and negative equity risk rises for recent borrowers with high loan-to-value ratios.
What Comes Next for Australian Housing Finance
The forward path depends on three variables that are currently pulling in different directions. Interest rates are near a cyclical peak, and any easing would reduce servicing costs and improve borrowing capacity, but the timing of cuts remains uncertain and depends on inflation outcomes. The tax changes are now legislated and will continue to shape investor returns regardless of rate movements. Price expectations, meanwhile, are the most volatile of the three and could shift quickly if clearance rates stabilise or if a sustained period of flat prices convinces buyers that the floor has been reached.
The most likely near-term scenario is continued weakness in investor lending alongside stabilisation in owner-occupier borrowing, producing a headline figure that remains negative but less dramatic than the September quarter. That pattern would be consistent with the government's rebalancing narrative while still imposing real adjustment costs on the market. A sharper downside scenario would involve owner-occupier lending also contracting materially, which would signal that confidence effects have spread beyond the investor segment and that the correction has become broad-based rather than compositional.
Signals Worth Monitoring
Several indicators will reveal which scenario is unfolding. The first is the split between investor and owner-occupier lending in the December quarter: if the gap narrows because investor lending stabilises, the tax effect may be largely priced in; if it narrows because owner-occupier lending falls, the correction is broadening. The second is rental vacancy rates, which will show whether reduced investor activity is constraining supply. The third is the trajectory of auction clearance rates, which tend to lead price indices by several months and provide the earliest signal of a change in bargaining power.
Lender behaviour deserves particular attention. If banks maintain or expand their loan books toward owner-occupiers, the credit contraction may prove self-limiting. If they tighten serviceability buffers or reduce maximum loan-to-value ratios in response to falling prices, the contraction could extend well beyond the policy shock that initiated it. The difference between these outcomes is not visible in the current data, but it will determine whether the September quarter proves to be the trough of the adjustment or merely its opening chapter.
Lessons for Policy Design
The episode offers a broader lesson about sequencing and communication in housing policy. Announcing structural tax changes alongside an active monetary tightening cycle concentrates their effects into a narrow window, producing a sharper adjustment than either policy would generate alone. A more gradual implementation schedule, or clearer public explanation of the expected magnitude of the combined effect, might have smoothed the transition without abandoning the policy objective. That is not an argument against the changes themselves, but it is an argument for treating policy interaction as a first-order design consideration rather than an afterthought.
The gap between Treasury's structural forecast and the observed decline also highlights the limits of conventional modelling when multiple channels interact. Structural forecasts are built to estimate long-run effects under stable conditions, not to predict the short-run dynamics that emerge when tax changes, rate rises and sentiment shifts coincide. Acknowledging that limitation publicly would strengthen rather than weaken institutional credibility, because it would signal that forecasts are being treated as analytical tools rather than political commitments. Markets tend to reward that kind of honesty over time.
Reading the Record Decline in Perspective
The September quarter housing finance data will be remembered as the moment Australia's investor-driven property market visibly changed direction. A 31 per cent collapse in investor lending, set against a 5 per cent decline in owner-occupier borrowing, describes a compositional shift that no single policy lever could have produced alone. Five rate rises, structural tax changes and self-reinforcing price expectations combined to create a contraction that is both record-breaking in scale and revealing in composition, and the political contest over causation has already begun in earnest.
What remains genuinely uncertain is whether this proves to be a controlled rebalancing or the opening phase of a longer correction. The government's framing emphasises the former, the opposition's the latter, and the data support elements of both. Prices are falling faster than Treasury projected, clearance rates are softening, and investor credit has withdrawn sharply, yet owner-occupier demand has held up well enough to suggest that households buying homes to live in remain engaged. That combination is unusual, and it is why the next two quarters of data will matter more than any single release.
For analysts, the lesson is to resist reading a single quarter as a verdict. Housing finance is a lagging indicator of policy and a leading indicator of prices, and the interaction between the two is what determines outcomes. The record decline is real, the rebalancing is partial, and the adjustment is unfinished. Tracking the split between investor and owner-occupier lending, watching rental vacancy rates, and monitoring lender behaviour will provide a clearer picture than any headline figure, and that is where attention should now be directed.
From our network :
- The Hidden Cost of AI Convenience: Why Over-Permissioned Agents Are a Security Time BombDiscover why AI agents with excessive permissions create dangerous single points of failure, and learn how implementing least privilege principles can protect your organization from exploitation.
- How AI Agents Will Change the Way We Manage Personal FinancesExplore how AI agents are transforming personal finance through automated budgeting, bill payment, and investment management, while examining the critical security protocols and governance frameworks required for safe deployment.
- Mobile Learning and VR in English: What Global Evidence Reveals About Effective Language TechnologyA systematic review across 14 countries reveals which language-learning technologies genuinely work. Mobile learning, AI, and VR show measurable benefits when pedagogically integrated. This evidence-based guide helps educators and learners select technology that delivers real return on investment.
- University Language Proficiency Exams: Why Institutional Tests Demand Different Preparation Than IELTS and TOEFLDiscover why university-specific language proficiency examinations differ fundamentally from IELTS and TOEFL, and learn strategic preparation approaches for institutional assessment success.
- Live Online English Classes for Kids: Do They Actually Reduce Anxiety?A ten-week study reveals that synchronous online English classes can significantly reduce child language anxiety while improving listening and reading skills. Discover what makes these programs effective and how parents can select the right one.
- CISA’s Ten-Advisory Wave: Why Generic Patching Fails in OT and How to Build Product-Specific PlaybooksCISA released ten ICS advisories in one week, exposing critical infrastructure risks. Generic patching fails in OT. Learn to build product-specific remediation playbooks.
- Committed Mediterranean Precipitation Decline: Why Emissions Cuts Alone Cannot Restore Winter RainsNew NOAA research reveals that Mediterranean winter rains may decline irreversibly even with emissions cuts. Explore the science of committed climate change and regional impacts.
- Forbidden Matrix Patterns and Visible Lattice Points: A Geometric DictionaryExplore how multidimensional 0–1 matrices encode geometric truths, linking forbidden patterns to visible lattice points and hypergraph theory, with applications in combinatorics and computational geometry.
- The Final Descent: How ESA Retired the Legendary Cluster Constellation After 24 Years of Space Weather ScienceAfter 24 years mapping Earth’s magnetosphere, ESA’s Cluster mission concluded with a precisely controlled reentry over the South Pacific. This analysis explores the scientific legacy, engineering decisions, and debris mitigation principles behind one of space exploration’s most responsible retirements.
RESOURCES
- Prices, Finance and Investor Attitudes | Bulletin – July 2002 | RBArba.gov.auLending to Investors. Borrowing for investment in residential property has been a common investment strategy in Australia for many years. Historically, a ...
- Lending indicators, March Quarter 2026abs.gov.auMay 13, 2026 ... Housing finance. Number of new loan commitments for dwellings (a), seasonally adjusted, Australia. Download.
- Assessing the Effects of Housing Lending Policy Measuresrba.gov.auAlthough the interest rate premium for IO loans relative to P&I loans was similar for investor and owner-occupier loans, the decline in the IO…
- Lending indicators, June Quarter 2026 - Australian Bureau of Statisticsabs.gov.auAug 14, 2026 ... Housing finance. Number of new loan commitments for dwellings (a), seasonally adjusted, Australia. Download.
- The effects of macroprudential policy restricting housing investor ...sciencedirect.comThe residential lending market in Australia is dominated by four large banks whose loans account for around 80 percent of total housing credit in…
- Plummeting demand from property investors drives record fall in ...abc.net.au11 hours ago ... New figures show a record drop in new home loans, falling 15 per cent overall in the September quarter. Investor…
- New home loans dropped by a record 15% as Australia's housing ...theconversation.com11 hours ago ... The rules reduced the share of lending to investors, while the price of investor-acquired homes also declined relative to other…
- Sydney, Melbourne Housing Investors Pull Back After Tax Changesbloomberg.comAug 13, 2026 ... Property Investors Pull Back. New loans to investors drop the most in more than three years. Source: Australian Bureau of…
- Westpac reports 20% drop in mortgage applications after Australia ...reuters.comAug 9, 2026 ... Australia's second-largest lender Westpac Banking Corp reported a 20% fall in mortgage applications and forecast investor housing credit ...
- New home loans across Australia have fallen 15 per cent in the ...facebook.com14 hours ago ... New home loans across Australia have fallen 15 per cent in the September quarter, with investor lending recording its steepest…
- Q2 Australian dwelling finance: Decline gathers pace - Westpac IQwestpaciq.com.auAug 14, 2026 ... The weakness was accounted for mainly by lower lending volumes: loan ... housing credit growth. Click on above PDF link…
- Investor mortgage applications plunge as Budget tax reforms bitempamag.comJul 24, 2026 ... New Loan Market Group data shows investor loan applications sliding sharply as negative gearing reforms and three RBA rate hikes…
- Lending to property investors falls sharply in 'tiny' step towards fairer ...theguardian.comAug 14, 2026 ... Investor loans led the decline, falling by 8.6% in the June quarter after a 4.7% drop in the previous period.…
- Recent developments in the Australian housing market - The Treasurytreasury.gov.auDec 4, 2003 ... Coinciding with the decline in share prices, investor activity as a share of total housing finance has also increased significantly,…
- Lending and confidence numbers to show rate rise impactau.finance.yahoo.com4 days ago ... The Australian Bureau of Statistics is expected to reveal on Wednesday that the decline in new home loan numbers accelerated…
- 01
- 02
- 03
- 04
- 05
- 06
- 07
- 08
0 Comments