When CNN announced that it would publish voter polls tracking who voted and how in the 2026 election, the network was doing more than scheduling a data release. It was signaling a specific philosophy of election coverage: that the story of an election is not merely who won, but which Americans showed up, which groups stayed home, and how the composition of the electorate shaped the final result. These surveys, modeled on the exit polls that have anchored broadcast analysis for decades, blend interviews conducted before Election Day with interviews held at polling places, producing a portrait intended to represent the full electorate rather than a single slice of it.
The mechanics matter as much as the headlines. CNN has said the figures will be updated through Election Night, and that the final numbers will be weighted to match official election results once those are certified. The polling itself is conducted by SSRS, a research firm with a long record in public opinion measurement. In the published tables, each column will show how voters in a particular demographic group split their vote, while the number at the top of each column indicates how large that group is within the electorate. The network also plans to publish methodology notes and guidance on how to read the results, an acknowledgment that voter polls are frequently misread.
Understanding this initiative requires understanding what voter polls are and are not. They are not forecasts, and they are not substitutes for the official count. They are instruments for explaining an outcome after the fact, and increasingly during the count itself. The distinction between a poll that predicts and a poll that describes is central to interpreting any table CNN publishes, and it is the thread that runs through the analysis below, from survey design and weighting to the demographic storytelling that determines how election nights are narrated.
On This Page
- The Architecture of Voter Polls and What They Measure
- Reading the Tables: Columns, Shares, and Vote Splits
- Weighting, Updating, and the Convergence on Official Results
- The Demographic Story: Who Votes and What It Reveals
- Trust, Transparency, and the Future of Election Polling
- Frequently Asked Questions About CNN's 2026 Voter Polls
TL;DR CNN will publish voter polls for the 2026 election that combine pre-Election Day interviews with polling-place interviews to describe who turned out and how each group voted. Conducted by SSRS and updated through Election Night, the results will be weighted to match official outcomes, with each column showing a group's vote split and its share of the electorate. The value of these surveys lies less in prediction than in explanation: they reveal the demographic composition of the electorate and the coalition arithmetic behind the result, provided readers understand their methodology, their margins of error, and the difference between a snapshot and a forecast.
The Architecture of Voter Polls and What They Measure
Voter polls occupy a peculiar space in American political journalism. They are commissioned by news organizations, executed by independent research firms, and released in formats that resemble election results more than they resemble traditional public opinion surveys. Their purpose is explanatory rather than predictive. A pre-election horse-race poll asks voters whom they intend to support; a voter poll asks them whom they actually supported and, crucially, records the demographic characteristics that allow analysts to reconstruct the shape of the electorate. That reconstruction is what allows a network to say, with some evidentiary basis, that a candidate won one group decisively while losing another by a narrower margin.
The hybrid methodology CNN describes reflects a practical compromise. Interviewing voters only at polling places captures those who cast ballots in person on Election Day but misses early voters, absentee voters, and those who voted by mail, groups that have grown substantially in recent cycles. Supplementing polling-place interviews with pre-Election Day interviews conducted by telephone or online allows the survey to reach a broader cross-section. The trade-off is complexity: mixing modes introduces the risk of mode effects, where respondents answer differently depending on how they are interviewed, and it demands careful weighting to reconcile the different samples into a single coherent picture.
From Exit Polls to Continuous Voter Tracking
The exit poll has been a fixture of American election coverage since the 1960s, when television networks began stationing interviewers outside polling places to capture voters' choices and motivations as they left. For decades the format was rigid: a single day of interviewing, a rapid tabulation, and a set of demographic cross-tabs released shortly after polls closed. The model worked because voting itself was concentrated on a single day. As early voting, mail balloting, and absentee participation expanded, that assumption eroded, and the traditional exit poll began to miss a growing share of the electorate.
CNN's approach reflects the industry's adaptation to that shift. By combining interviews conducted before Election Day with interviews at polling places, the survey attempts to cover the full arc of voting behavior rather than a single moment. The continuous updating through Election Night further blurs the line between survey and live result. This is a meaningful evolution: the voter poll becomes less a snapshot taken at one instant and more a rolling reconstruction that converges on the official count as returns come in, with each revision narrowing the gap between sample and reality.
The Role of SSRS and Methodological Transparency
SSRS, the research firm conducting the surveys, is a familiar name in American public opinion research, known for social science polling and for its work on major media-sponsored surveys. Its involvement lends the project a measure of institutional credibility, though credibility in polling is never absolute. The firm's methods, including sampling frames, response rates, and weighting procedures, determine how closely the published portrait resembles the actual electorate. CNN's commitment to publishing information on how the surveys were conducted is therefore not a courtesy but a condition of meaningful interpretation.
Transparency in polling methodology has become a contested value in recent years. Critics argue that disclosure often arrives in dense technical language that few readers parse, while defenders counter that the alternative, opaque numbers presented without context, is worse. The practical middle ground is guidance on how to read results: explaining what a column share means, why subgroups carry wider margins of error, and why early figures may shift as weighting is refined. When a network publishes both the numbers and the instructions for reading them, it treats its audience as capable of understanding uncertainty rather than merely consuming a headline.
Reading the Tables: Columns, Shares, and Vote Splits
The published format of a voter poll is deceptively simple. Each column represents a demographic group, and the number at the top of the column indicates that group's share of the electorate. Beneath it, the vote split shows how members of that group distributed their support among the candidates. Read together, these figures answer two distinct questions: how large was each group, and how did each group behave? The first question is about composition, the second about preference. Confusing the two is the most common error in election analysis, and it produces conclusions that sound precise but rest on a misreading of what the table actually reports.
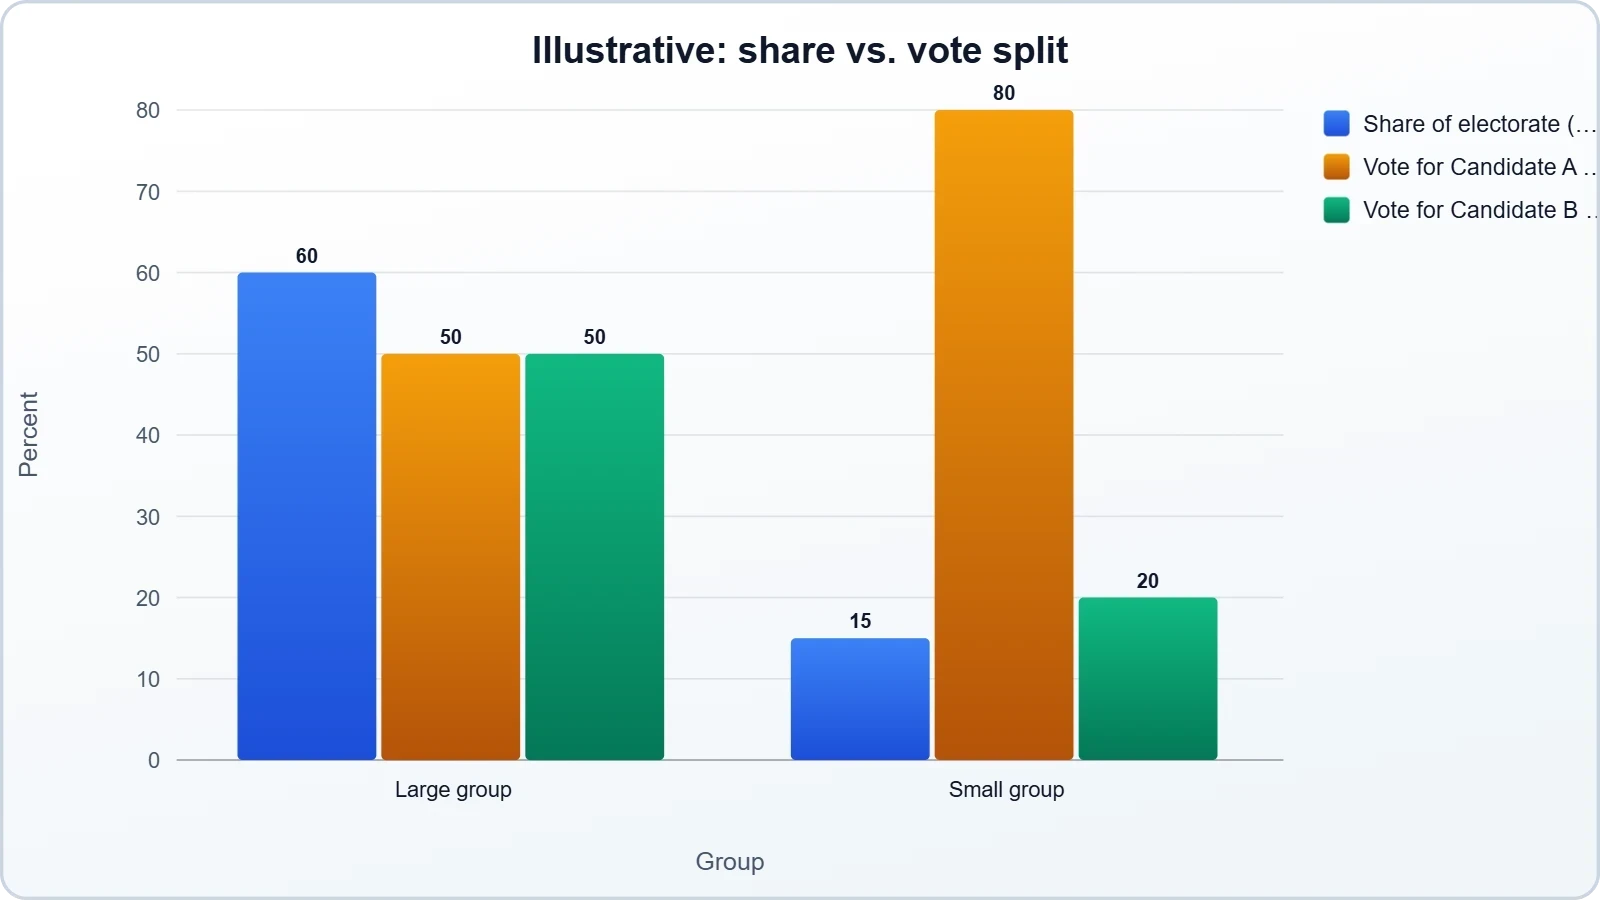
Consider a hypothetical in which one group constitutes a large share of the electorate but splits its vote nearly evenly, while a smaller group votes overwhelmingly for one candidate. The smaller group may dominate headlines because its preference is stark, yet the larger group's even split may have done more to determine the outcome. The table permits this kind of reasoning, but only if the reader attends to both dimensions simultaneously. Column shares without vote splits describe an electorate without explaining it; vote splits without column shares describe preferences without context. The analytical value emerges from the interaction of the two.
Why Column Shares Matter as Much as Vote Splits
Election analysis frequently privileges the vote split because it is the more dramatic number. A group that votes 70 percent for one candidate produces a vivid headline, while the group's share of the electorate appears as a modest percentage at the top of a column. Yet the share figure is often the more consequential of the two. A candidate who wins a group by a wide margin gains little if that group is small, and a candidate who loses a large group narrowly may still be competitive overall. The arithmetic of coalitions depends on multiplication, not on the intensity of any single preference.
This is why voter polls are indispensable for post-election explanation. They allow analysts to decompose a result into its components: how much of a candidate's total came from high-turnout groups, how much from defections among traditional supporters, and how much from shifts in the composition of the electorate itself. Without the column shares, the vote splits float free of consequence. With them, the table becomes a ledger of coalition arithmetic, showing which groups supplied the margin and which groups, despite their enthusiasm, were too small to matter.
Margins of Error and the Limits of Subgroup Analysis
Every survey carries sampling error, and the error grows as the subgroup shrinks. A national sample of a few thousand respondents may yield a reasonably precise estimate of the overall vote, but a subgroup representing a small fraction of the electorate may rest on only a few hundred interviews, or fewer. The margin of error for such a subgroup can be wide enough to encompass outcomes that look politically opposite. Published tables rarely display these margins prominently, which means readers must supply the skepticism that the format does not enforce.
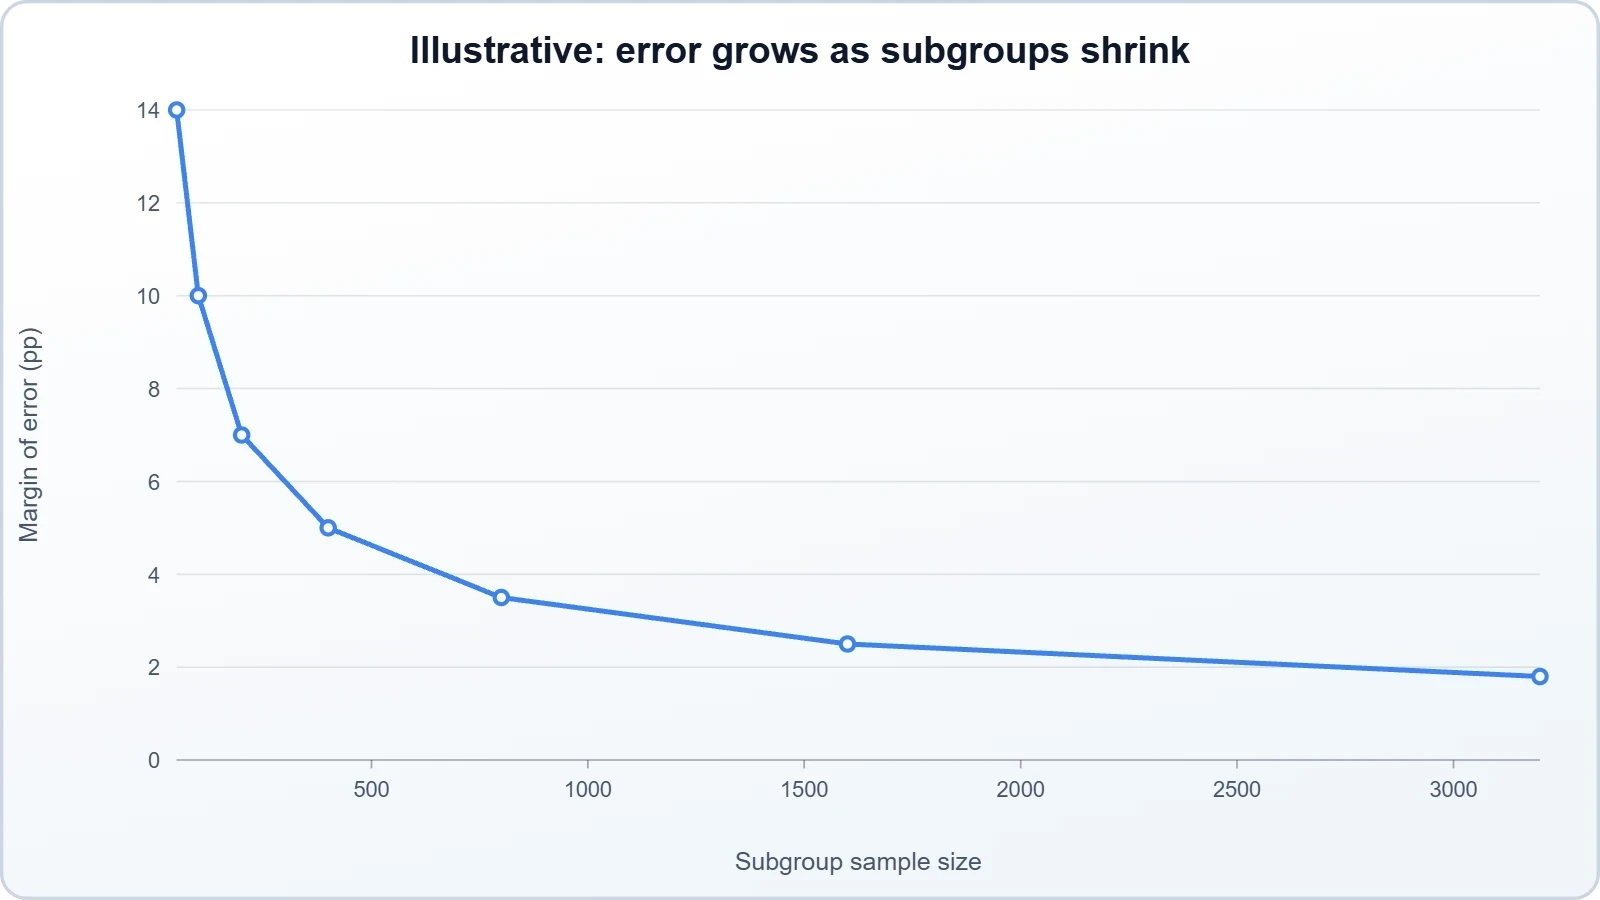
The practical implication is that small differences between subgroups should not be overinterpreted. A gap of a few percentage points between two groups may be statistical noise rather than a meaningful signal. Responsible analysis therefore focuses on patterns that are large and consistent rather than on narrow distinctions that flatter a preferred narrative. CNN's decision to publish guidance on reading results acknowledges this problem, though no amount of guidance can fully compensate for the human tendency to see significance in every number a table displays.
We Also Published
Weighting, Updating, and the Convergence on Official Results
The most technically demanding element of CNN's plan is the commitment to weight final numbers to match official election results. Weighting is the process by which survey data are adjusted so that the sample's composition reflects known characteristics of the population. In voter polls, the known characteristics are the actual election results themselves, which provide an authoritative record of how many votes each candidate received and, in aggregate, what the electorate looked like. By aligning the survey to that record, the network transforms a sample into a reconstruction, reducing the discrepancy between what respondents reported and what the count ultimately showed.
This approach has an obvious appeal and a subtler cost. The appeal is accuracy: a weighted survey can describe the electorate with far greater fidelity than an unweighted one. The cost is that the weighting process can obscure the survey's original findings, making it difficult to distinguish between what respondents said and what the adjustment imposed. When a table is weighted to match official results, the reader is seeing a hybrid: part interview data, part official record. That hybrid is useful, but it is not a pure measurement, and treating it as one misrepresents what the numbers actually are.
The Difference Between a Snapshot and a Forecast
A voter poll is not a prediction, and the distinction is not semantic. A forecast estimates an outcome that has not yet occurred; a voter poll describes an outcome that has occurred, using interviews to explain it. The confusion arises because both appear as numbers during election coverage, often in the same broadcast, and because the updating process makes voter polls look predictive as they evolve. But the underlying logic is different. The poll's authority derives from its correspondence to the actual electorate, not from its ability to anticipate it.
This distinction has practical consequences for how results should be consumed. A forecast can be wrong in the ordinary sense of failing to anticipate an outcome. A voter poll can be inaccurate in a different sense: it can misdescribe an electorate that has already voted. The relevant question is not whether the poll predicted the winner but whether its demographic portrait matches the certified result. When CNN weights final numbers to official outcomes, it is explicitly acknowledging that the poll's purpose is description, and that its accuracy should be judged against the record rather than against the future.
How Continuous Updating Shapes Public Perception
The decision to update figures through Election Night introduces a dynamic that traditional exit polls did not have. As numbers change over the course of an evening, viewers may perceive instability where there is only refinement, or interpret a shift in a subgroup's composition as a shift in sentiment. The psychological effect is significant: a table that revises itself appears less authoritative than one released once, even if the final version is more accurate. Networks must therefore manage expectations, signaling clearly which figures are provisional and which have been weighted to final results.
There is also a competitive dimension. In a media environment where multiple outlets publish voter polls simultaneously, the network that updates fastest may capture attention, while the network that waits for accuracy may appear slow. The tension between speed and precision is inherent to election coverage, and it is not easily resolved. CNN's commitment to publishing methodology alongside results is one response to that tension, offering readers the tools to distinguish between a preliminary estimate and a settled finding, provided they take the trouble to use them.
- 01
- 02
- 03
- 04
The Demographic Story: Who Votes and What It Reveals
Beneath the technical apparatus lies a simpler and more consequential question: who votes? Voter polls exist because the answer to that question is not fixed. The composition of the electorate shifts from cycle to cycle, shaped by turnout patterns, demographic change, and the relative enthusiasm of different groups. A candidate who wins the same share of a group's vote as a predecessor may still lose if that group's share of the electorate declines. Conversely, a candidate may lose ground among a group yet prevail because that group grew. The demographic story is the story of these movements.
This is why the column share figures at the top of each table deserve as much attention as the vote splits beneath them. They record the shape of the electorate, and the shape of the electorate is itself a political outcome. High turnout among one group and low turnout among another can determine a result as surely as any shift in preference. Voter polls make that dynamic visible, allowing analysts to say not only how groups voted but how their participation, or absence, shaped the contest. The table becomes a map of who showed up.
Coalition Arithmetic and the Margin of Victory
Every election result can be expressed as a sum of group contributions, and voter polls make that sum visible. A candidate's coalition is not a monolith but a collection of groups, each contributing a share of the total vote determined by its size and its preference. When analysts speak of a coalition fraying or consolidating, they are describing changes in these contributions. The table format, with its column shares and vote splits, is essentially a ledger of that arithmetic, allowing the reader to see which groups supplied the margin and which fell short.
The arithmetic also exposes a common analytical error: attributing an outcome to the group that shifted most rather than the group that contributed most. A dramatic shift among a small group may be politically salient but arithmetically minor, while a modest shift among a large group may be decisive. Voter polls allow this distinction to be drawn, provided the reader resists the temptation to treat every movement as equally consequential. The margin of victory is a sum, and the largest terms in that sum are not always the most discussed.
Interpreting Group Behavior Without Overreach
Demographic analysis carries an inherent risk of overreach. A finding that a group voted in a particular way can slide into a claim about why the group voted that way, and the second claim is not supported by the first. Voter polls record behavior, not motivation. They can show that a group's support shifted, but they cannot by themselves explain whether the shift reflected economic concerns, cultural attitudes, candidate characteristics, or something else entirely. The discipline of interpretation requires holding that distinction firmly.
Responsible coverage therefore treats voter polls as a starting point for inquiry rather than a conclusion. The numbers describe the shape of the electorate and the distribution of preferences; the reasons behind those patterns require additional evidence, from open-ended survey questions, from focus groups, and from the broader record of the campaign. When a network publishes guidance on reading results, it is implicitly acknowledging this limit. The table tells you what happened among groups; it does not tell you why, and the gap between the two is where careful journalism lives.
Trust, Transparency, and the Future of Election Polling
Public confidence in polling has eroded over the past decade, damaged by high-profile misses and by a broader skepticism toward institutional expertise. Voter polls occupy a somewhat different position than pre-election surveys because they are anchored to actual results, but they are not immune to the same distrust. The publication of methodology, the disclosure of the conducting firm, and the guidance on reading results are all attempts to rebuild credibility through transparency. Whether they succeed depends less on the volume of disclosure than on whether readers find the disclosures intelligible and the results consistent with what they observe.
The future of election polling likely lies in the direction CNN is moving: hybrid methodologies, continuous updating, and closer integration with official results. The traditional exit poll, conducted on a single day and released in a burst, is poorly suited to an electorate that votes over weeks. The voter poll, which follows the electorate across modes and time, is better adapted to that reality. But adaptation brings new complexities, and the industry's ability to explain those complexities to a distracted public will determine whether the resulting numbers are trusted or merely consumed.
Rebuilding Confidence Through Disclosure
Transparency is necessary but not sufficient. A network can publish every methodological detail and still fail to earn trust if the results appear inconsistent with lived experience or if the presentation obscures uncertainty. The more effective approach combines disclosure with explanation: not merely stating that results are weighted, but showing what weighting does and why it changes the numbers. CNN's plan to provide guidance on reading results gestures toward this, though the effectiveness of such guidance depends on how prominently it is displayed and how clearly it is written.
The deeper challenge is cultural. Polling literacy is not widely taught, and the conventions of election coverage, with their emphasis on winners and margins, encourage a binary reading of numbers that are inherently probabilistic. A table showing that a group split its vote 52 to 46 conveys a difference that may or may not be meaningful, and readers without statistical training have little basis for judging. Closing that gap requires sustained effort from newsrooms, not a single methodology page published alongside a set of results.
What the 2026 Precedent May Mean for Coverage
If CNN's voter polls succeed in explaining the 2026 electorate with clarity and accuracy, they will likely establish a template that other networks follow. The hybrid methodology, the continuous updating, and the weighting to official results are all replicable, and competitive pressure will push rivals toward similar approaches. The precedent matters because it shapes expectations: once audiences become accustomed to voter polls that describe the electorate in detail, coverage that offers only a winner and a margin will seem thin by comparison.
The risk is that imitation will outpace rigor. A methodology that works when executed carefully by an experienced firm can produce misleading results when adopted hastily by organizations without comparable resources. The value of CNN's approach lies not in the format alone but in the combination of format, execution, and disclosure. Networks that copy the format while neglecting the execution will produce tables that look authoritative and mislead. The 2026 cycle will therefore be a test not only of one network's polling but of the industry's willingness to treat voter polls as instruments of explanation rather than spectacle.
Frequently Asked Questions About CNN's 2026 Voter Polls
Readers encountering voter poll tables for the first time often have the same set of questions, and the answers are more straightforward than the tables themselves. The most common confusion concerns the relationship between the polls and the official count, followed by questions about how the surveys are conducted and why the numbers change over the course of an evening. Addressing these questions directly is useful because the format's credibility depends on readers understanding what they are looking at, and misunderstanding is the default state for anyone encountering a demographic cross-tab without prior exposure.
The questions below reflect the practical concerns that arise whenever a network publishes detailed electorate data. They cover the source of the polling, the meaning of the column figures, the reason for weighting, and the appropriate level of confidence to place in subgroup results. None of the answers requires statistical training, but together they establish the interpretive frame within which the published numbers should be read. A reader who understands these points will be better equipped to follow election night coverage without mistaking provisional figures for settled conclusions.
What the Polls Can and Cannot Tell Us
The polls can tell us the composition of the electorate, the distribution of preferences among groups, and the arithmetic of the coalition that produced a result. They cannot tell us why voters chose as they did, whether their stated preferences were stable, or how the outcome might have differed under other circumstances. The boundary between description and explanation is firm, and crossing it requires evidence the polls do not supply. Recognizing that boundary is the beginning of polling literacy, and it is the most valuable takeaway for any reader approaching these tables.
What the polls also cannot do is resolve the deeper questions of democratic legitimacy that election coverage often gestures toward. A table showing that a candidate won a particular group does not establish that the group's interests will be represented, nor that the outcome reflects a stable majority. Those are political questions, not statistical ones, and voter polls are merely one input among many. The temptation to treat demographic data as a complete account of an election is strong, but the data describe the electorate's shape, not its meaning, and the meaning is always contested.
Practical Guidance for Following Election Night Coverage
For readers planning to follow election night coverage, a few practical habits make the flood of numbers more intelligible. First, distinguish between provisional and final figures, and treat any number released before certification as subject to revision. Second, read the column shares alongside the vote splits, since the interaction between the two carries most of the analytical weight. Third, be skeptical of small differences between subgroups, which may reflect sampling error rather than genuine variation. Fourth, consult the methodology notes rather than relying on the presentation alone.
These habits do not require statistical expertise, only a willingness to slow down. Election coverage is designed for speed, and the format of voter poll tables rewards careful reading over rapid reaction. A reader who pauses to check whether a figure is weighted, whether a subgroup is large enough to support the comparison being made, and whether the difference being highlighted is meaningful will extract far more from the coverage than one who simply absorbs the headlines. The tables are tools, and like any tool they work best when the user understands their design.
From our network :
- The Final Descent: How ESA Retired the Legendary Cluster Constellation After 24 Years of Space Weather ScienceAfter 24 years mapping Earth’s magnetosphere, ESA’s Cluster mission concluded with a precisely controlled reentry over the South Pacific. This analysis explores the scientific legacy, engineering decisions, and debris mitigation principles behind one of space exploration’s most responsible retirements.
- Forbidden Matrix Patterns and Visible Lattice Points: A Geometric DictionaryExplore how multidimensional 0–1 matrices encode geometric truths, linking forbidden patterns to visible lattice points and hypergraph theory, with applications in combinatorics and computational geometry.
- University Language Proficiency Exams: Why Institutional Tests Demand Different Preparation Than IELTS and TOEFLDiscover why university-specific language proficiency examinations differ fundamentally from IELTS and TOEFL, and learn strategic preparation approaches for institutional assessment success.
- Mobile Learning and VR in English: What Global Evidence Reveals About Effective Language TechnologyA systematic review across 14 countries reveals which language-learning technologies genuinely work. Mobile learning, AI, and VR show measurable benefits when pedagogically integrated. This evidence-based guide helps educators and learners select technology that delivers real return on investment.
- CISA’s Ten-Advisory Wave: Why Generic Patching Fails in OT and How to Build Product-Specific PlaybooksCISA released ten ICS advisories in one week, exposing critical infrastructure risks. Generic patching fails in OT. Learn to build product-specific remediation playbooks.
- Live Online English Classes for Kids: Do They Actually Reduce Anxiety?A ten-week study reveals that synchronous online English classes can significantly reduce child language anxiety while improving listening and reading skills. Discover what makes these programs effective and how parents can select the right one.
- Committed Mediterranean Precipitation Decline: Why Emissions Cuts Alone Cannot Restore Winter RainsNew NOAA research reveals that Mediterranean winter rains may decline irreversibly even with emissions cuts. Explore the science of committed climate change and regional impacts.
- How AI Agents Will Change the Way We Manage Personal FinancesExplore how AI agents are transforming personal finance through automated budgeting, bill payment, and investment management, while examining the critical security protocols and governance frameworks required for safe deployment.
- The Hidden Cost of AI Convenience: Why Over-Permissioned Agents Are a Security Time BombDiscover why AI agents with excessive permissions create dangerous single points of failure, and learn how implementing least privilege principles can protect your organization from exploitation.
RESOURCES
- Resources will be updated soon.
- 01
- 02
- 03
- 04
- 05
- 06
- 07
- 08
0 Comments