On 5 November 2026, a terse market dispatch from Dawn reported a familiar but consequential divergence: equity markets across the world advanced while crude oil prices tumbled. The headline itself carries the entire factual payload of the original report, which offered no figures, no sector attribution, and no explanation of the forces at work. That brevity is precisely what makes the item worth examining. A single sentence about stocks rising and oil falling encodes a specific configuration of global capital flows, and reading that configuration properly requires us to reconstruct the mechanics that a wire headline compresses into a handful of words.
Markets rarely move in isolation, and the relationship between equities and energy is one of the most closely watched couplings in macro finance. When shares climb while crude slides, the immediate question is whether the two moves share a common cause or reflect separate stories running in parallel. A demand-led oil decline can be benign for equities, lowering input costs and supporting margins. A supply-driven collapse tells a different story, often signalling geopolitical relief or a production decision by major exporters. Distinguishing between these interpretations is the analytical core of this post.
What follows is a structured reading of the event: the transmission channels linking oil to equity valuations, the sector-level winners and losers, the currency and inflation implications, and the historical precedents that give the headline its context. Each section isolates one layer of the story, moving from the mechanics of the price move to the strategic questions investors and policymakers should be asking. The aim is not to invent details the source omitted, but to supply the interpretive framework that a one-line market report leaves implicit.
On This Page
- The Macroeconomic Logic Behind Diverging Equity and Oil Markets
- Sector Rotation: Who Wins and Who Loses When Crude Falls
- Currency, Inflation, and Central Bank Consequences
- Historical Precedents for Equity Rallies Alongside Oil Declines
- Reading a Sparse Market Report Without Overreaching
- Strategic Implications for Portfolios and Policy
TL;DR A global equity rally accompanied by falling oil prices on 5 November 2026 describes a classic macro divergence with multiple possible drivers. Falling crude typically benefits oil-importing economies, transport and consumer sectors, and disinflationary policy settings, while pressuring energy producers and exporters. The headline alone cannot tell us whether the oil move reflects weak demand, rising supply, or geopolitical de-escalation, and each scenario carries different implications for equities, currencies, and central bank policy. This analysis maps the transmission channels, sector exposures, and historical analogues that give the brief report its full meaning.
The Macroeconomic Logic Behind Diverging Equity and Oil Markets
A simultaneous equity rally and oil selloff is one of the most studied configurations in cross-asset analysis, because the two markets respond to overlapping but distinct forces. Equities price future corporate earnings discounted at prevailing interest rates, while crude prices reflect the physical balance of supply and demand plus a financial layer of positioning and hedging. When the two diverge, the market is effectively telling us that the forces lifting corporate valuations are stronger than, or separate from, those depressing energy commodities. Understanding which forces dominate requires attention to growth expectations, inflation data, and monetary policy signals.
Transmission Channels From Crude to Corporate Earnings
Oil enters equity valuations through several distinct channels. The most direct is the cost channel: energy is an input for airlines, logistics firms, manufacturers, and utilities, so cheaper crude compresses operating costs and expands margins for energy consumers. The second is the consumer channel, where lower pump prices release household disposable income toward discretionary spending, supporting retail, hospitality, and consumer services. A third channel runs through inflation expectations, since energy is a volatile but heavily weighted component of consumer price baskets, and softer oil prices can pull headline inflation lower within months.
The fourth channel is financial rather than fundamental. Oil is a heavily traded macro asset with deep derivatives markets, and large moves in crude often coincide with shifts in risk appetite, dollar strength, and positioning across commodity-linked currencies. When oil falls while equities rise, portfolio flows frequently rotate out of energy equities and commodity funds into growth and technology names. That rotation can amplify the headline divergence beyond what pure fundamentals would justify, which is why analysts distinguish between the initial catalyst and the subsequent flow-driven extension of a move.
Demand-Led Versus Supply-Led Oil Declines
The critical interpretive fork is whether falling oil reflects weakening demand or expanding supply. A demand-led decline, typically associated with slowing industrial activity in major economies, is ambiguous for equities: it lowers costs but also signals weaker revenue growth, and markets often rally initially before reassessing. A supply-led decline, driven by OPEC+ production decisions, rising output from non-cartel producers, or the unwinding of geopolitical risk premiums, is generally more benign for equities because it delivers cost relief without implying weaker aggregate demand.
Historical episodes illustrate the distinction clearly. The 2014–2016 oil collapse was supply-led, driven by shale output and OPEC's market-share strategy, and it coincided with a prolonged US equity bull market. By contrast, the sharp oil decline in early 2020 was demand-led, reflecting the pandemic shock, and equities fell in tandem before recovering on policy support. The 2026 headline, absent further detail, could belong to either category, and the appropriate equity interpretation hinges entirely on which one applies.
Sector Rotation: Who Wins and Who Loses When Crude Falls
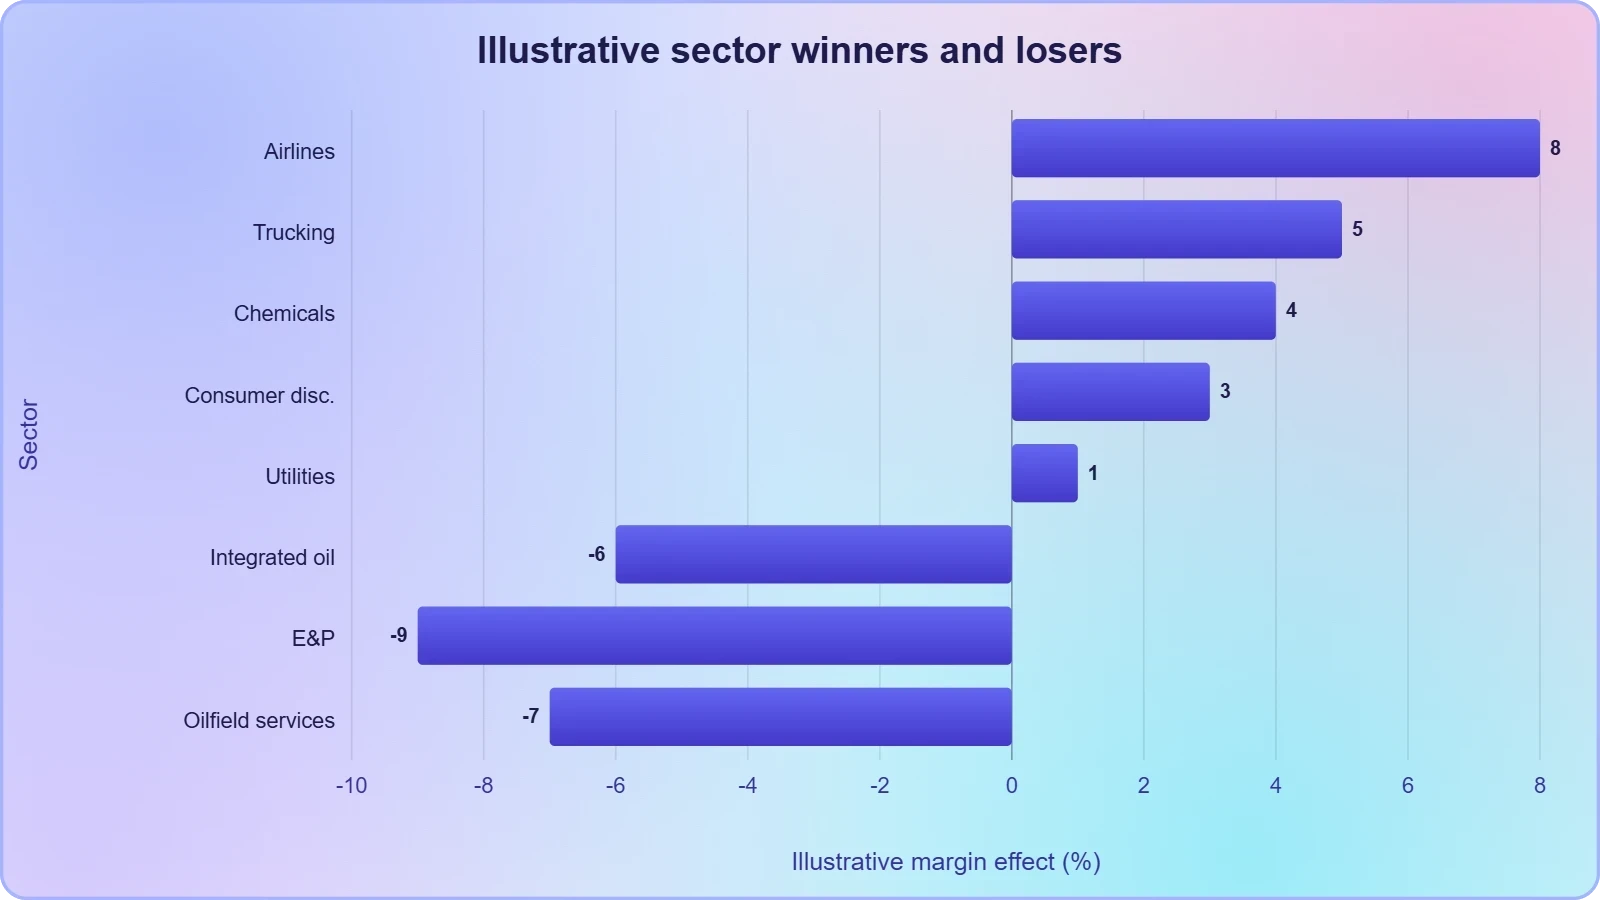
Within the equity rally described in the report, the composition of leadership matters as much as the index-level gain. Falling oil redistributes profitability across sectors with unusual clarity, rewarding energy consumers and penalizing energy producers. Investors reading a headline about stocks rising should therefore ask which sectors drove the advance. If the rally was broad-based and led by industrials, transport, and consumer discretionary names, it is consistent with a benign cost-relief story. If gains were concentrated in defensive sectors while energy lagged sharply, the underlying signal may be more cautious.
The Energy Sector's Direct Exposure
Integrated oil majors, exploration and production companies, and oilfield services firms see revenue and cash flow tied directly to crude benchmarks. A sustained decline compresses upstream margins, delays marginal projects, and can force dividend or buyback reassessments. Downstream refining operations sometimes benefit from cheaper feedstock, but the net effect for integrated majors is usually negative when crude falls sharply. Energy's weight in major indices means its underperformance can drag on headline index returns even when the majority of constituents advance, which is why index-level and breadth-level readings can diverge.
National oil companies and petrostates face a parallel fiscal squeeze. Budgets across the Gulf, Russia, and parts of Africa are calibrated to breakeven oil prices that often sit well above market levels during downturns. When crude falls, sovereign wealth funds may repatriate capital or slow outward investment, and currency pegs come under scrutiny. These sovereign responses feed back into global asset markets, affecting everything from real estate to private equity, and they represent a second-order effect that equity investors often overlook in the first days of an oil selloff.
Beneficiaries Across Transport, Consumer, and Industrials
Airlines are the textbook beneficiary, since fuel represents one of their largest variable costs and hedges typically cover only part of consumption. Trucking and logistics firms, shipping companies, and rail operators see similar relief. Consumer-facing businesses benefit through the disposable income channel, particularly discount retailers and leisure operators serving households that spend a meaningful share of income on fuel. Chemicals and plastics manufacturers use petroleum derivatives as feedstock, so cheaper crude flows through to input costs with a lag that can extend across several quarters.
Utilities present a more nuanced case. Gas prices often move with oil through contractual linkages and fuel-switching dynamics, so cheaper crude can lower generation costs, though regulated tariffs may delay the pass-through to margins. Emerging-market importers of energy, including India, Turkey, and much of Southeast Asia, receive a broad macroeconomic boost that supports domestic equities and currencies. For these economies, the oil price functions as a tax or subsidy on the entire corporate sector, and a decline is unambiguously expansionary at the aggregate level.
We Also Published
Currency, Inflation, and Central Bank Consequences
Oil is priced in dollars, so a crude decline interacts directly with foreign exchange markets. Importing nations see their trade balances improve, supporting their currencies, while exporters face deteriorating terms of trade and pressure on pegged exchange rates. The dollar itself often weakens when oil falls, since petrodollar recycling flows diminish and the United States shifts from importer to marginal exporter dynamics. These currency moves then feed back into equity returns for international investors, adding a layer of complexity that domestic-focused analysis can miss entirely.
Petrocurrencies and Terms of Trade
The Canadian dollar, Norwegian krone, and Russian ruble typically trade with a strong positive correlation to crude, reflecting their economies' dependence on hydrocarbon exports. A sustained oil decline weakens these currencies, which in turn raises imported inflation and complicates central bank decisions. For commodity importers such as India, Japan, and the euro area, the effect runs in reverse: cheaper energy improves the current account, supports the currency, and eases imported price pressures. These terms-of-trade shifts can persist for quarters and reshape relative equity market performance across regions.
Sovereign wealth funds add a financial channel. Gulf funds with large oil-linked inflows may slow or reverse outward investment during price downturns, reducing demand for global real estate, private equity, and listed equities. Russia's fiscal breakeven price has historically been among the highest among major producers, making its budget and currency especially sensitive. These sovereign responses are slow-moving but powerful, and they explain why oil shocks often transmit to asset classes far removed from energy itself, including prime real estate in London and New York.
Disinflation and the Policy Rate Path
Energy's weight in consumer price indices means falling crude mechanically reduces headline inflation with a lag of roughly one to three months, depending on the speed of pass-through at the pump and in utility bills. Central banks typically look through energy volatility when setting policy, focusing on core inflation and wage dynamics. However, a sustained oil decline can influence expectations and thus core inflation indirectly, particularly if it persists long enough to affect wage negotiations and pricing decisions across the broader economy.
The policy implication is asymmetric. If falling oil reinforces a disinflationary trend, central banks gain room to cut rates or slow the pace of tightening, which supports equity valuations through the discount rate channel. This is the most plausible mechanism linking an oil decline to a simultaneous equity rally, and it explains why markets often celebrate cheaper crude even when the underlying demand picture is uncertain. The discount rate effect can dominate the earnings effect in the short run, especially for long-duration growth stocks.
Historical Precedents for Equity Rallies Alongside Oil Declines
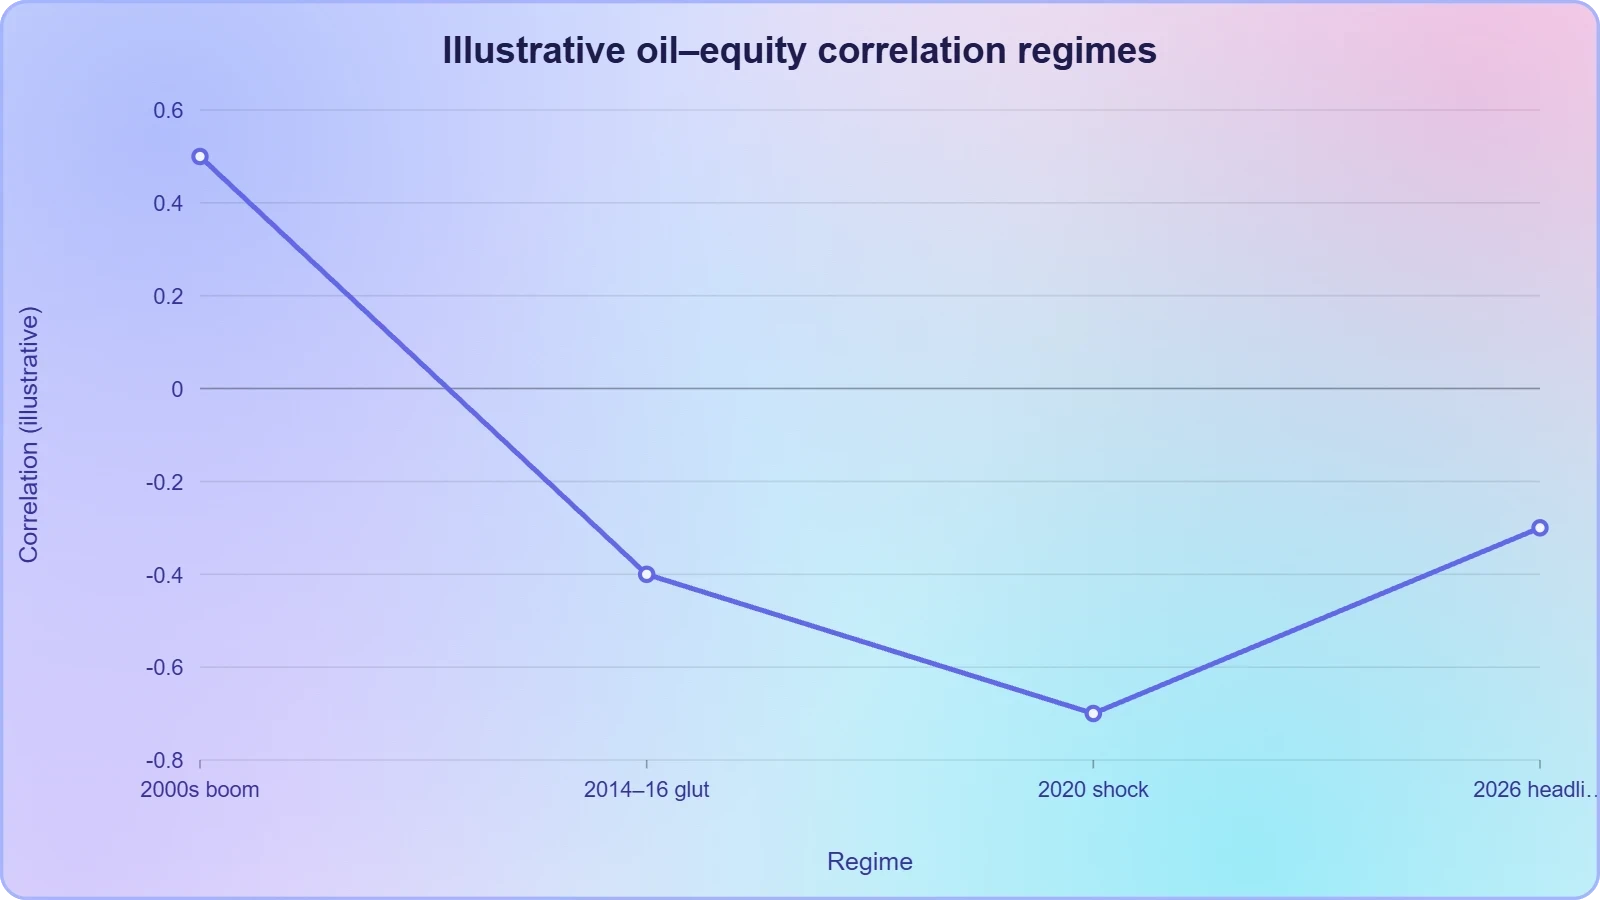
History offers a useful calibration for interpreting the 2026 headline. The relationship between oil and equities has shifted across regimes, and the correlation is not stable over time. In the 2000s, rising oil often accompanied rising equities during the commodity supercycle, as both reflected strong global growth. After the shale revolution and the 2014–2016 price collapse, the correlation flipped in many periods, with cheaper oil supporting equities in energy-importing economies. The 2026 configuration therefore belongs to a post-shale regime in which supply dynamics dominate.
Lessons From 2014–2016 and 2020
The 2014–2016 episode is the cleanest analogue for a supply-led decline. OPEC's decision to defend market share rather than prices, combined with surging US shale output, pushed crude from over $100 to below $30. Global equities, after an initial wobble, entered a sustained advance led by consumer and technology names, while energy equities and petrocurrencies suffered. The lesson is that supply-led oil declines can be powerfully bullish for diversified equity portfolios, provided the demand backdrop remains intact and credit markets do not seize up.
The 2020 collapse tells the opposite story. When demand evaporated during the pandemic, oil futures briefly turned negative, and equities fell sharply before policy intervention restored confidence. The distinguishing feature was the demand shock, which hit corporate revenues directly. For the 2026 event, the absence of any reported demand distress in the source material, combined with a broad equity rally, tilts the interpretation toward the supply-led or de-escalation scenario, though this remains an inference rather than a confirmed fact.
What the 2026 Configuration Suggests
Several features of the headline point toward a benign reading. A global equity rally is difficult to sustain if investors believe a demand collapse is underway, since earnings expectations would fall in tandem. The breadth implied by "markets around the world" suggests a macro driver rather than an idiosyncratic sector story. Falling oil alongside rising equities is most consistent with either supply expansion, geopolitical risk-premium unwinding, or a disinflationary impulse that supports rate-cut expectations, all of which are equity-friendly in the near term.
Prudence still demands caveats. Headlines compress complex sessions into single sentences, and the underlying moves may have been modest in magnitude. Without data on the size of the oil decline, the sectors leading the equity rally, or the currency moves accompanying both, the interpretation remains provisional. The disciplined approach is to treat the headline as a prompt for further investigation rather than a conclusion, and to watch subsequent inventory, production, and inflation data for confirmation of the scenario that best fits.
Reading a Sparse Market Report Without Overreaching
The original Dawn item is a reminder that financial journalism often operates at two speeds: the wire headline that captures a session's direction, and the analytical layer that explains why it happened. The headline is accurate and useful as a directional marker, but it deliberately omits magnitude, attribution, and causation. Professional readers learn to treat such reports as prompts, using them to trigger a structured investigation rather than as standalone conclusions. The discipline lies in distinguishing what is known from what is inferred.
What the Headline Establishes and What It Leaves Open
Established facts are limited but clear: global equity markets rose, oil prices fell, and the moves affected major markets and the energy sector. Everything else, including the size of the moves, the sectors driving the equity advance, the currencies involved, and the catalysts, remains unspecified. This is not a criticism of the report, which serves a legitimate purpose as a brief market note, but a recognition of the interpretive work required to extract meaning from it. The gap between headline and analysis is where professional judgment operates.
Investors should resist the temptation to overfit a narrative to a single data point. A one-day divergence between equities and oil is common and often reverses within weeks. The signal strengthens only when confirmed by related data: inventory builds, production announcements, inflation prints, and central bank commentary. The appropriate response is to note the configuration, form provisional hypotheses, and update them as evidence accumulates, rather than to commit to a definitive interpretation on the basis of a single sentence.
Practical Takeaways for Investors and Analysts
For portfolio managers, the event reinforces the value of monitoring cross-asset correlations rather than analyzing equities in isolation. Energy exposure, currency hedging, and sector rotation decisions all interact with oil prices, and a divergence like the one reported can signal shifts in relative value. For analysts covering energy, transport, or consumer sectors, the headline is a prompt to revisit margin assumptions and cost forecasts. For policymakers, it is a reminder that imported energy prices feed directly into inflation and growth outlooks.
The broader lesson concerns information hygiene. Sparse reports are not unreliable, but they are incomplete, and the professional habit is to supplement them with primary data before acting. Market participants who treat headlines as final answers tend to chase moves rather than anticipate them. Those who treat them as starting points, building a structured view of drivers and transmission channels, are better positioned to distinguish durable trends from noise. The 2026 divergence is best read in that spirit: a signal worth investigating, not a verdict to be accepted.
Strategic Implications for Portfolios and Policy
Translating the headline into portfolio decisions requires a view on persistence. A one-day oil decline is noise; a sustained trend is signal. If the 2026 move marks the beginning of a durable supply-driven decline, the strategic implications are substantial: overweight energy consumers and importers, underweight producers and petrocurrencies, and position for a disinflationary policy backdrop. If it proves transient, the appropriate response is to avoid overreacting and to maintain diversified exposure. The distinction hinges on data that the original report does not provide.
Positioning Across Asset Classes
Equity investors can express a benign oil-decline view through transport, consumer discretionary, and chemicals exposure, while trimming integrated energy and oilfield services. Fixed income benefits from disinflation through lower yields, particularly in importing economies where the inflation pass-through is fastest. Currency strategies favor importers' currencies against exporters', though carry and central bank divergence complicate the trade. Commodity allocations themselves require care, since a supply-driven decline can persist longer than momentum traders expect, and contango in futures markets erodes roll returns.
Alternative assets and real assets deserve attention as well. Real estate in energy-importing cities may benefit from lower operating costs and stronger household balance sheets, while energy-exporting regions face headwinds. Infrastructure funds with fuel-cost exposure see margin relief. Private equity portfolios with logistics and transport holdings gain, while those concentrated in upstream energy face valuation markdowns. The cross-asset reach of an oil move is precisely why it commands attention far beyond the energy desk, and why a single headline can ripple through diversified portfolios.
Policy Responses in Importing and Exporting Economies
Central banks in importing economies face a favorable trade-off when oil falls: lower headline inflation with growth intact allows either rate cuts or patience, depending on the starting point. Fiscal authorities may choose to pass through the savings to consumers or to rebuild subsidy buffers depleted during prior price spikes. Exporting economies face the opposite dilemma, balancing budget consolidation against social spending commitments, and often drawing on sovereign reserves to smooth the adjustment. These policy choices determine how quickly the oil move transmits to domestic activity.
Multilateral institutions watch oil prices closely because they shape current account balances across the developing world. A sustained decline eases external financing pressures for importers, reduces the risk of currency crises, and can lower sovereign borrowing costs. For exporters with weak fiscal buffers, the reverse applies, and the IMF and regional development banks may find themselves managing balance-of-payments stress. The 2026 headline, read through this lens, is not merely a market curiosity but a signal with real consequences for global financial stability.
From our network :
- University Language Proficiency Exams: Why Institutional Tests Demand Different Preparation Than IELTS and TOEFLDiscover why university-specific language proficiency examinations differ fundamentally from IELTS and TOEFL, and learn strategic preparation approaches for institutional assessment success.
- Committed Mediterranean Precipitation Decline: Why Emissions Cuts Alone Cannot Restore Winter RainsNew NOAA research reveals that Mediterranean winter rains may decline irreversibly even with emissions cuts. Explore the science of committed climate change and regional impacts.
- Live Online English Classes for Kids: Do They Actually Reduce Anxiety?A ten-week study reveals that synchronous online English classes can significantly reduce child language anxiety while improving listening and reading skills. Discover what makes these programs effective and how parents can select the right one.
- Forbidden Matrix Patterns and Visible Lattice Points: A Geometric DictionaryExplore how multidimensional 0–1 matrices encode geometric truths, linking forbidden patterns to visible lattice points and hypergraph theory, with applications in combinatorics and computational geometry.
- How AI Agents Will Change the Way We Manage Personal FinancesExplore how AI agents are transforming personal finance through automated budgeting, bill payment, and investment management, while examining the critical security protocols and governance frameworks required for safe deployment.
- CISA’s Ten-Advisory Wave: Why Generic Patching Fails in OT and How to Build Product-Specific PlaybooksCISA released ten ICS advisories in one week, exposing critical infrastructure risks. Generic patching fails in OT. Learn to build product-specific remediation playbooks.
- The Final Descent: How ESA Retired the Legendary Cluster Constellation After 24 Years of Space Weather ScienceAfter 24 years mapping Earth’s magnetosphere, ESA’s Cluster mission concluded with a precisely controlled reentry over the South Pacific. This analysis explores the scientific legacy, engineering decisions, and debris mitigation principles behind one of space exploration’s most responsible retirements.
- Mobile Learning and VR in English: What Global Evidence Reveals About Effective Language TechnologyA systematic review across 14 countries reveals which language-learning technologies genuinely work. Mobile learning, AI, and VR show measurable benefits when pedagogically integrated. This evidence-based guide helps educators and learners select technology that delivers real return on investment.
- The Hidden Cost of AI Convenience: Why Over-Permissioned Agents Are a Security Time BombDiscover why AI agents with excessive permissions create dangerous single points of failure, and learn how implementing least privilege principles can protect your organization from exploitation.
RESOURCES
- Short-Term Energy Outlook, global oil markets - EIAeia.govAlthough we raised our crude oil price forecast from last month, we still expect oil prices will generally fall from their early October average.…
- Oil prices surge as Iran escalates tanker attacks, shares fall | Reutersreuters.comMar 12, 2026 ... In bond markets, the risk of rising inflation outweighed safe-haven considerations to push yields higher globally. Yields on 10-year Treasury ...
- Crude oil prices fell in 2025 amid oversupply - U.S. Energy ... - EIAeia.govJan 5, 2026 ... ... global crude oil market exceeding demand. Crude oil ... Generally, crude oil prices tend to decrease as global petroleum…
- Oil Market Report - March 2026 - IEAiea.orgMar 12, 2026 ... Global oil consumption is now set to increase by 640 kb/d y-o-y in 2026 – down 210 kb/d from last…
- Oil prices climb again, as global stocks gain - Reutersreuters.comAug 12, 2026 ... Market Talk: Can the Fed get away with not hiking rates? Summary; Companies. July US CPI up 0.1% after June ...
- Oil prices fall and shares jump after US-Iran deal announced - BBCbbc.comJun 15, 2026 ... Global energy markets have been on a wild ride in recent months, with prices often rising or falling sharply in…
- Stock market news for March 2, 2026 - CNBCcnbc.comMar 2, 2026 ... U.S. oil prices came off their highest levels of the session, easing concerns about the war's impact on the U.S.…
- Stocks slip on Wall Street under pressure from rising oil prices, bond ...pbs.orgSep 1, 2026 ... The bond sell-off is global, with other nations facing the same economic pressures. READ MORE: Analyst breaks down challenges U.S.…
- As oil market surplus keeps rising, something's got to give - IEAiea.orgOct 17, 2025 ... Crude oil prices remained largely resilient, as stock builds were concentrated in areas that have less direct influence on price…
- Most U.S. stocks fall as oil prices get back to rising | PBS Newspbs.orgMar 11, 2026 ... Since the start of the Iran war, sharp moves for oil prices have triggered swings up and down for financial…
- Stock market today: Live updates - CNBCcnbc.comMar 20, 2026 ... This caused oil prices to climb, with Brent crude topping $113 a barrel at its high of the day and…
- Examining Record Soybean Oil Prices in 2021–22ers.usda.govDec 21, 2022 ... ... oil supply, contributed to a decline in global vegetable oil stocks and a rise in international and domestic vegetable…
- Iran Conflict: Seven Takeaways for Investors | Morgan Stanleymorganstanley.comMar 3, 2026 ... ... oil prices, hotter inflation and greater market uncertainty. ... Morgan Stanley Research estimates that a 10% rise in oil…
- The Great Plunge in Oil Prices: Causes, Consequences and Policy ...worldbank.orgOil prices could increase more rapidly than anticipated if the U.S. shale industry responds to falling oil ... “Oil price risk and emerging stock…
- Gas prices soar and oil jumps as Iran war pushes down global stock ...theguardian.comMar 2, 2026 ... Gas prices soar and oil jumps as Iran war pushes down global stock markets ... rise in oil prices. Brent…
- 01
- 02
- 03
- 04
- 05
- 06
- 07
- 08
0 Comments