The final week of October 2026 delivered a striking demonstration of how quickly sentiment can shift on the Nigerian Exchange, with the All-Share Index climbing 2.86 per cent to settle at 254,299.49 points while market capitalisation advanced in lockstep to N165.114 trillion. What makes this rally instructive is not merely the headline percentage but the mechanics beneath it: trading volume exploded from 2.024 billion shares to 7.619 billion shares week-on-week, a nearly fourfold surge that transformed a modest upward drift into a liquidity event. Investors clearly returned to the market with conviction rather than caution.
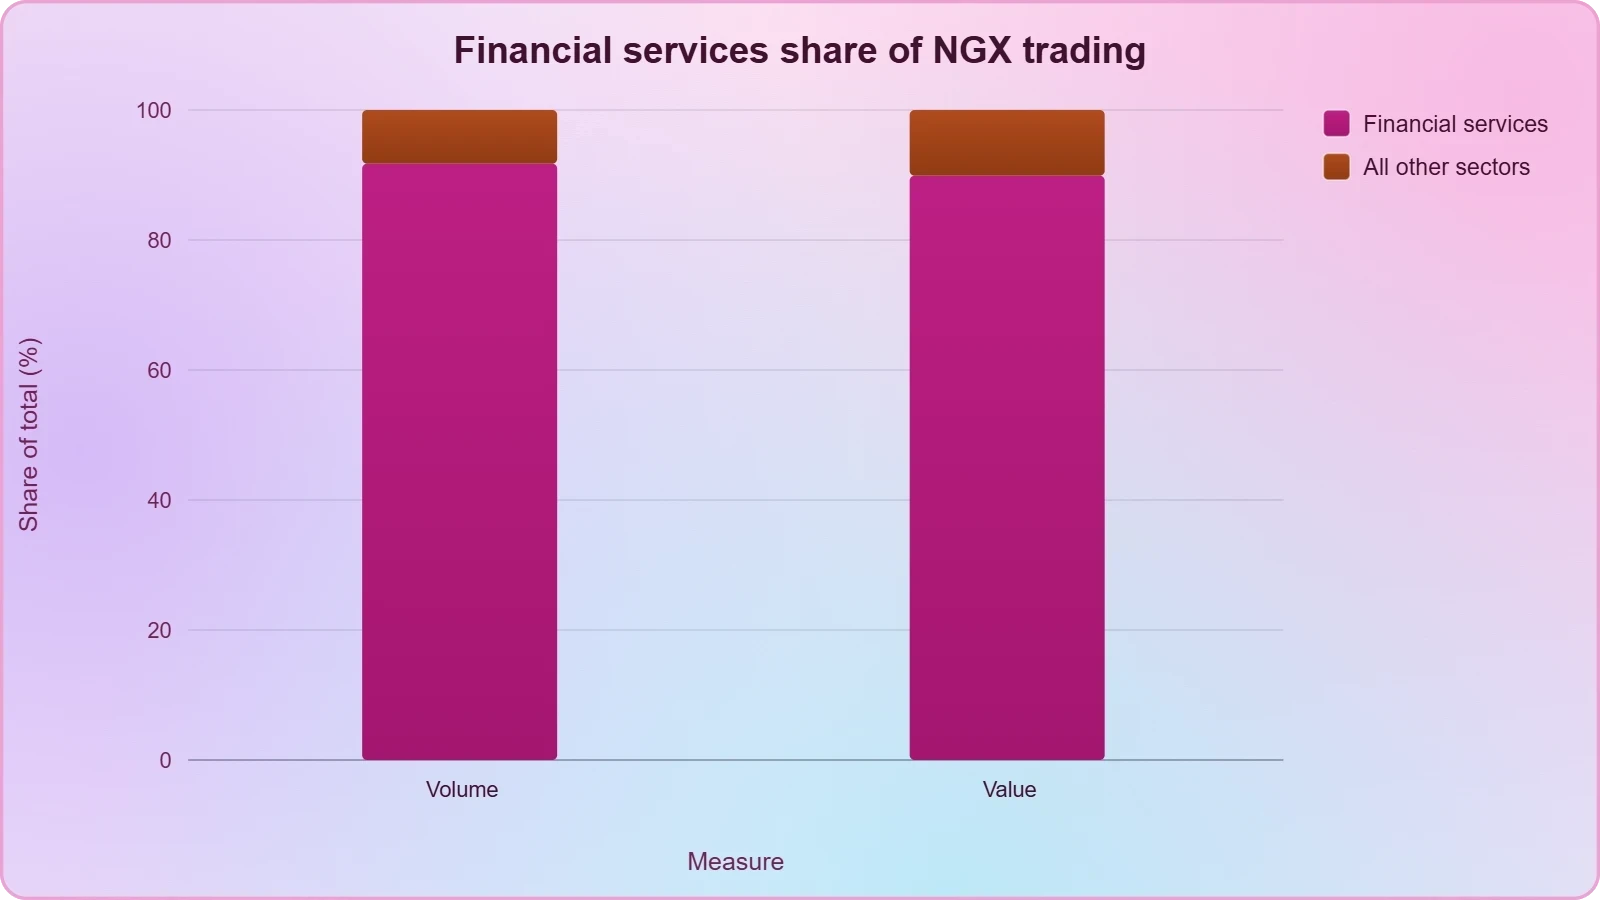
The composition of that activity tells its own story. Financial services stocks dominated the tape, accounting for 91.75 per cent of total equity volume and 89.91 per cent of total value, with three banking heavyweights — First Holdco Plc, Guaranty Trust Holding Company Plc and United Bank for Africa Plc — alone responsible for 80.02 per cent of volume and 85.36 per cent of value. This concentration reveals a market where institutional money moves through a narrow corridor of liquid large caps, leaving the broader universe of mid and small-cap equities comparatively starved of attention despite the index's headline strength.
Beneath the surface, however, the picture is more nuanced than a simple bullish narrative suggests. Seven sectoral indices — including Banking, Insurance, Consumer Goods and the Main Board — actually declined even as the composite index rose, and the breadth statistics show 48 decliners against 33 gainers. This divergence between index performance and market breadth is a classic signature of cap-weighted rallies driven by a handful of heavyweights, and it deserves careful reading from anyone interpreting the week's numbers as a broad-based recovery.
On This Page
- The Anatomy of a Volume-Driven Weekly Rally
- Sector Performance: A Rally That Split the Market
- Market Breadth: The Numbers Behind the Headline
- Financial Services Dominance and the Concentration Risk
- Exchange-Traded Products and the Fixed Income Market
- What the Week Signals for Investors and the Road Ahead
TL;DR Nigeria's NGX All-Share Index rose 2.86 per cent in the week ended 30 October 2026, closing at 254,299.49 with market capitalisation of N165.114 trillion, powered by a fourfold jump in trading volume to 7.619 billion shares worth N637.826 billion. Financial services stocks, particularly First Holdco, GTCO and UBA, dominated activity, yet seven sectoral indices fell and decliners outnumbered gainers 48 to 33 — a rally concentrated in large caps rather than spread across the market. New listings in commercial paper, savings bonds and corporate bonds rounded out a busy week for primary market activity.
The Anatomy of a Volume-Driven Weekly Rally
Market rallies come in two basic varieties: those driven by broad-based buying interest and those powered by concentrated institutional flows into a handful of liquid names. The final week of October 2026 on the Nigerian Exchange belongs firmly in the second category, and understanding why requires looking past the 2.86 per cent index gain to the raw transaction data underneath. When volume multiplies nearly fourfold in a single week while the number of deals rises only modestly, from 173,113 to 192,138, the implication is unmistakable: average trade size expanded dramatically, signalling block activity from large institutional participants rather than a wave of retail enthusiasm.
The value figures reinforce this reading. Total turnover of N637.826 billion against the prior week's N110.773 billion represents a 475 per cent increase in naira value, far outpacing the 276 per cent rise in share volume. That gap between value growth and volume growth indicates that the shares changing hands carried higher average prices — consistent with heavy trading in banking majors rather than penny stocks. The market's centre of gravity shifted decisively toward established, high-priced financial institutions, and the index followed their lead accordingly.
Reading the Turnover Mathematics
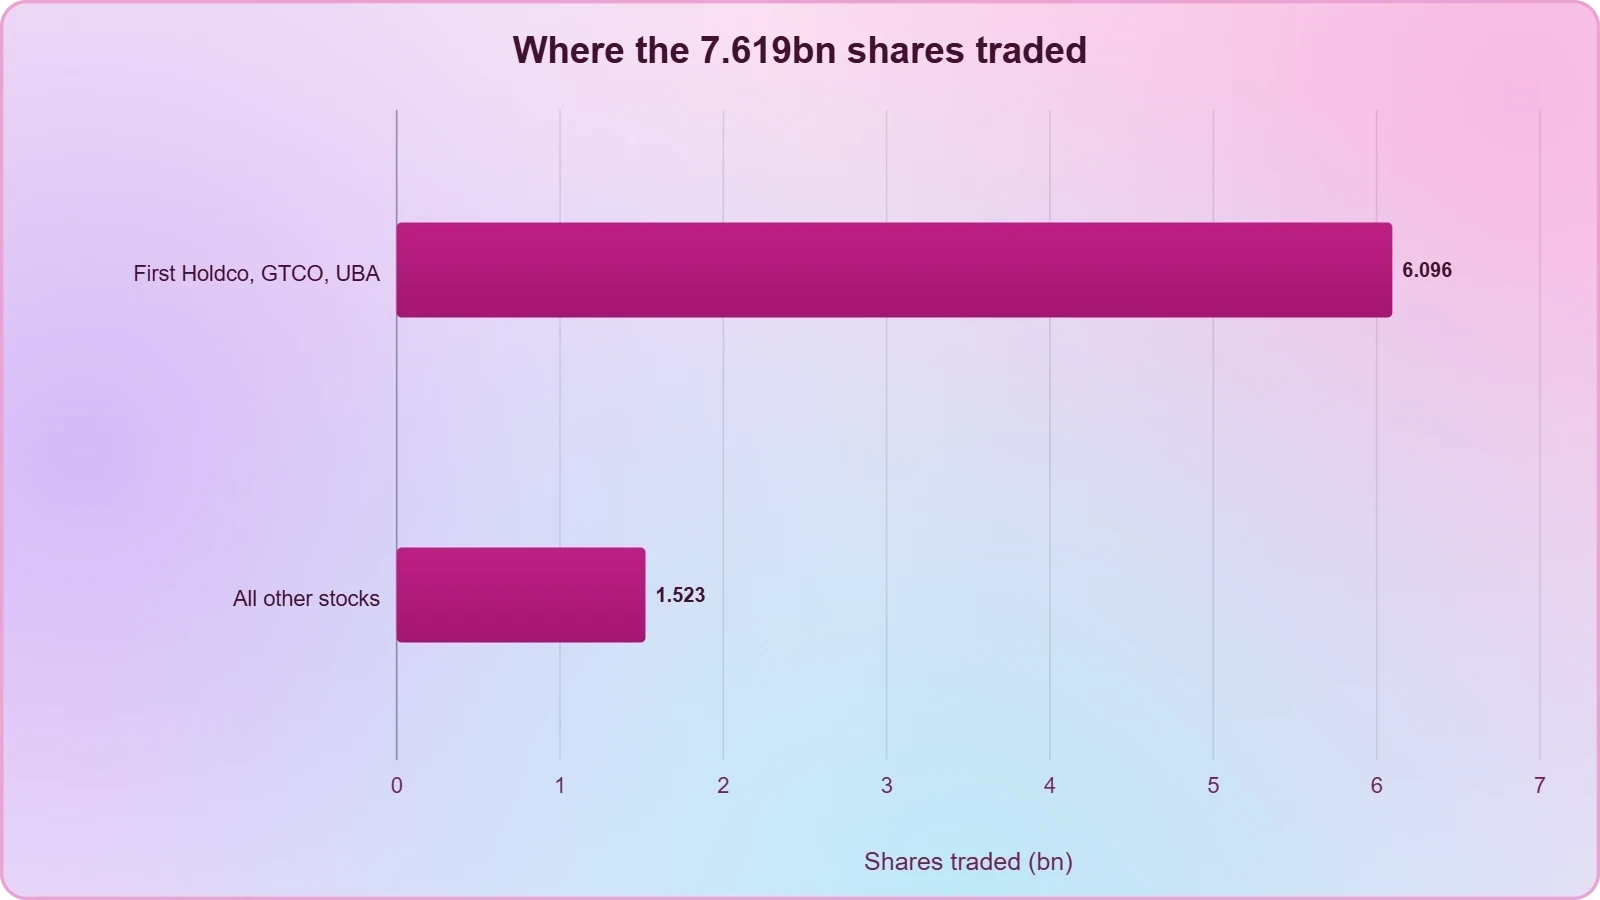
The arithmetic of the week rewards close attention because it exposes how thin the rally's foundation actually was. Of the 7.619 billion shares traded, 6.096 billion — fully 80.02 per cent — changed hands in just three stocks: First Holdco, GTCO and UBA. In value terms those three names accounted for N544.438 billion of the N637.826 billion total, or 85.36 per cent. Strip them out and the remaining market traded roughly 1.5 billion shares worth about N93 billion, a far more modest picture than the headline turnover implies.
This concentration has practical implications for how investors should interpret the week's performance. A market whose index movement is dictated by three banking stocks is, functionally, a banking index wearing a broader label. When those names attract institutional flows — whether from dividend positioning, index rebalancing or foreign portfolio reallocation — the composite index rises regardless of conditions elsewhere. Conversely, any reversal in banking sentiment would drag the entire index down with it, which is precisely the fragility that breadth statistics are designed to reveal.
Why Deal Count Matters More Than Headlines
The modest 11 per cent increase in the number of deals, set against a 276 per cent surge in share volume, is the single most diagnostic statistic of the week. Retail participation typically manifests as a rising deal count, because individual investors trade in smaller lots. When volume balloons while deal count barely moves, the marginal buyer is almost certainly an institution executing large orders, possibly through block trades or programme-driven accumulation. This distinction matters enormously for anyone trying to forecast whether the rally has staying power.
Institutional flows can reverse as quickly as they arrive, particularly when they are driven by tactical positioning around events such as dividend dates or index rebalancing rather than by fundamental revaluation. The week's data offers a suggestive clue here: Zenith Bank traded ex-dividend on 26 October 2026, with a last close of N120.90 and a dividend of N1.50. Dividend-related repositioning across the banking sector may well have contributed to the concentrated flows into First Holdco, GTCO and UBA, which would frame the volume spike as event-driven rather than a durable shift in market appetite.
Sector Performance: A Rally That Split the Market
The most revealing feature of the week is the divergence between the composite index and the sectoral indices. While the All-Share Index rose 2.86 per cent, seven sub-indices moved in the opposite direction: the NGX Main Board fell 0.11 per cent, NGX CG dropped 1.70 per cent, NGX Banking declined 3.42 per cent, NGX Insurance lost 2.13 per cent, NGX Consumer Goods slipped 0.02 per cent, NGX Growth fell 1.02 per cent and NGX Commodity eased 0.38 per cent. A banking index falling 3.42 per cent in the same week that banking stocks powered the composite index higher is a paradox that demands explanation.
The resolution lies in the difference between price performance and trading activity. The banking stocks that dominated volume were not necessarily the ones that rose most; heavy trading can occur alongside price declines when large holders distribute positions. Meanwhile, the composite index's advance was anchored by specific gainers, most notably Dangote Cement's extraordinary 27.81 per cent surge from N1,111.00 to N1,420.00. A single industrial heavyweight of that scale can move a cap-weighted index substantially on its own, which explains how the ASI rose while the Main Board index, tracking a different basket, slipped.
The Dangote Cement Effect
Dangote Cement's 27.81 per cent weekly gain is the kind of move that reshapes index mathematics. As one of the largest listed companies by market capitalisation on the NGX, its weight in the All-Share Index is substantial, and a rally of that magnitude in a single week can account for a meaningful share of the composite's 2.86 per cent advance almost by itself. The industrial goods sector, rather than financial services, may therefore have been the true engine of index performance, even as banks dominated the volume tables.
This distinction between where the money traded and where the prices moved is a recurring theme in Nigerian market analysis and one that casual observers frequently miss. Financial services generated 91.75 per cent of volume and 89.91 per cent of value, yet the Banking index fell 3.42 per cent. Industrial shares, by contrast, may have traded far less but delivered the price appreciation that lifted the composite. Volume tells you where attention was focused; price change tells you where value was created. The two were pointing in different directions during this particular week.
Market Breadth: The Numbers Behind the Headline
Breadth statistics are the market's internal audit, and this week's audit produced a verdict that sits awkwardly beside the bullish headline. Thirty-three equities gained in price, up from 20 the week before, which is genuinely encouraging. But 48 equities fell, down from 55 previously, and 65 remained unchanged against 71 in the prior week. The ratio of gainers to decliners stood at roughly 0.69 to 1, meaning that for every three stocks that rose, more than four declined. A market where the index rises 2.86 per cent while most individual stocks fall is a market driven by weights, not by widespread prosperity.
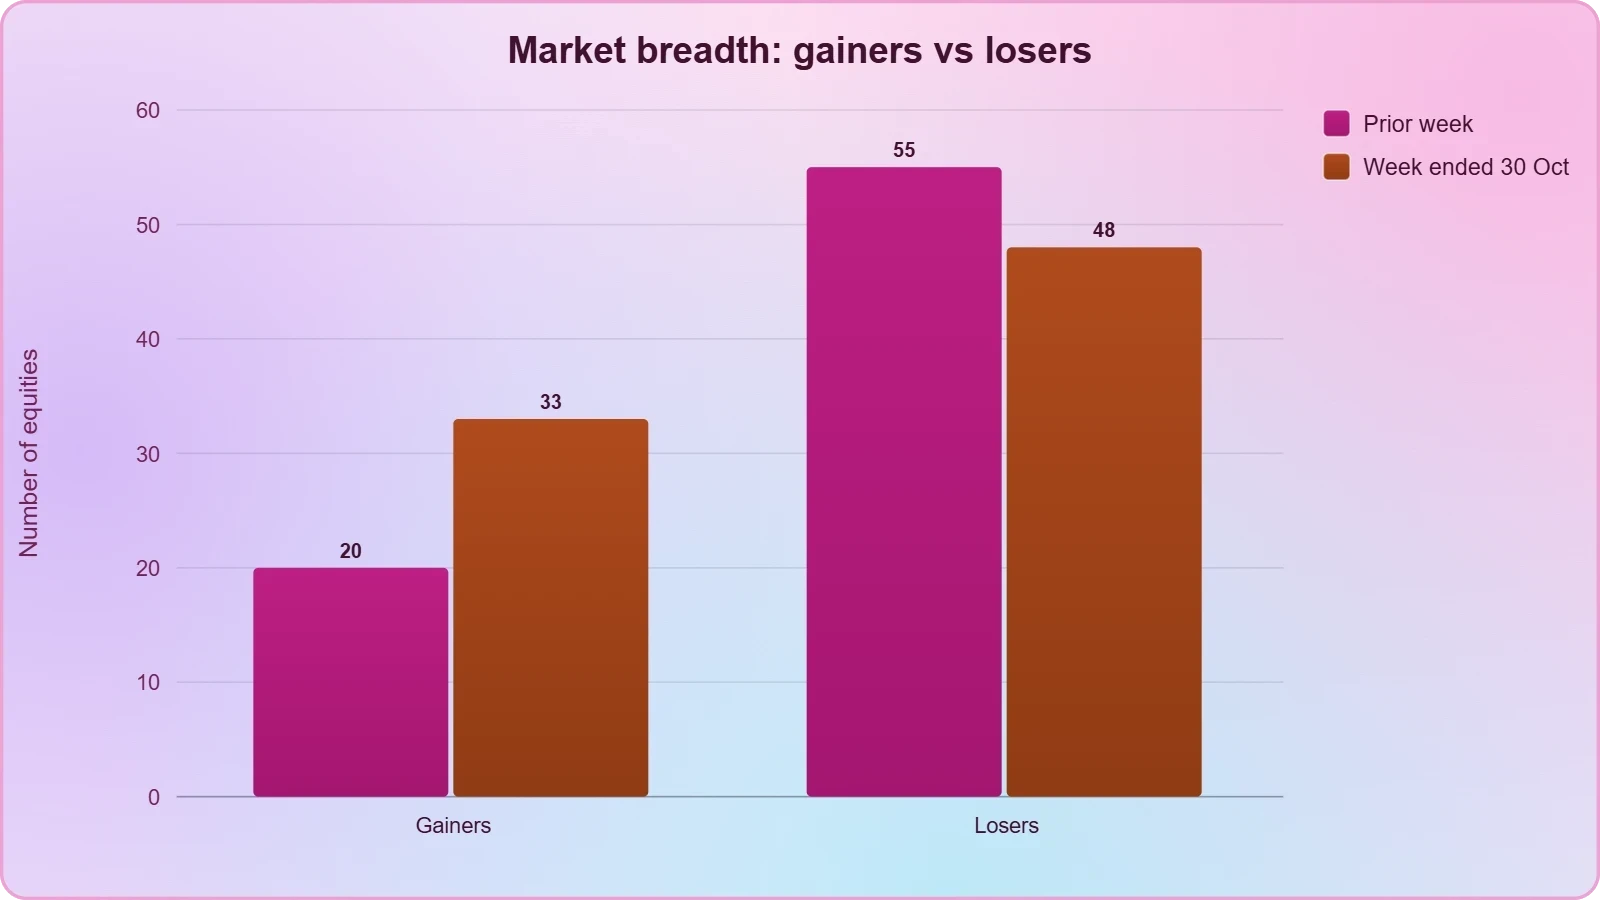
The improvement in the gainers count, from 20 to 33, does suggest that sentiment is thawing at the margins. More stocks participated in upside movement than in the previous week, and the decline in the number of losers from 55 to 48 points in the same direction. Yet the absolute figures remain sobering: with 48 decliners against 33 gainers, the median stock in the market lost value during a week when the headline index gained nearly three per cent. Investors holding diversified portfolios may well have found their returns lagging the index considerably.
Gainers, Losers and the Extremes
The extremes of the week illustrate the dispersion beneath the averages. Dangote Cement led gainers with a 27.81 per cent advance, a move large enough to dominate index arithmetic. At the other end, Caverton Offshore Support Group Plc led decliners, falling 25.00 per cent from N4.80 to N3.60 — a reminder that small-cap volatility can be brutal even in a rising market. The gap between the best and worst performer, spanning more than 52 percentage points in a single week, underscores how misleading a single index number can be as a summary of investor experience.
For portfolio managers, this dispersion is both a risk and an opportunity. The risk lies in benchmark-hugging strategies that capture the index's rise while missing the fact that most constituents fell. The opportunity lies in stock selection: a market where individual outcomes diverge so widely rewards careful fundamental analysis over passive exposure. The week's data effectively argues that the NGX in late October 2026 was not one market but several, each with its own dynamics, and that treating it as a monolith would be an analytical error with real financial consequences.
- 01
- 02
- 03
- 04
We Also Published
Financial Services Dominance and the Concentration Risk
The financial services sector's grip on trading activity this week was near-total: 6.990 billion shares worth N573.492 billion across 85,998 deals, representing 91.75 per cent of equity volume and 89.91 per cent of value. Consumer goods trailed distantly with 164.650 million shares worth N7.201 billion in 20,297 deals, while services managed 93.278 million shares worth N1.567 billion in 9,932 deals. These figures describe a market where one sector effectively is the market, and where the other sectors function as peripheral activity rather than meaningful drivers of price discovery or liquidity.
Such concentration carries structural risks that deserve explicit acknowledgement. When nearly nine in every ten naira traded flows through a single sector, the market's resilience depends disproportionately on the health of that sector's largest institutions. Any shock to banking sentiment — a regulatory change, a monetary policy shift, a credit event — would reverberate through the entire exchange with amplified force. Diversification at the market level, in other words, is considerably thinner than the existence of multiple listed sectors might suggest to a casual observer.
The Big Three: First Holdco, GTCO and UBA
Within financial services, three names absorbed the overwhelming majority of activity. Trading in First Holdco Plc, Guaranty Trust Holding Company Plc and United Bank for Africa Plc accounted for 6.096 billion shares worth N544.438 billion in 27,001 deals — 80.02 per cent of total volume and 85.36 per cent of total value. These are among the most liquid and widely held banking franchises in Nigeria, and their dominance of the tape reflects their status as the default vehicles for institutional exposure to Nigerian equities.
The concentration in these three stocks has implications that extend beyond the week's statistics. It means that price discovery for the broader market is effectively delegated to a handful of banking counters, and that the NGX's headline index is hostage to their fortunes. For foreign portfolio investors seeking Nigerian exposure, these names are the practical entry point; for domestic pension funds and asset managers, they are the core holdings around which portfolios are built. The result is a self-reinforcing liquidity premium that keeps attention and capital focused on the same small group of securities.
Exchange-Traded Products and the Fixed Income Market
Beyond the equity market, the week's activity in exchange-traded products and bonds offers a useful window into how investors were positioning across asset classes. Exchange-traded products recorded 1.346 million units worth N512.142 million in 4,472 deals, up from 1.128 million units worth N244.251 million in 3,298 deals the previous week. The value of ETP trading more than doubled even as unit volume rose modestly, indicating that the average transaction size increased substantially — again consistent with institutional rather than retail participation.
Vetbank led ETP activity with 373,329 units, followed by StanbicETF30 and Vetgrif30. The prominence of these particular products is instructive: they cater to investors seeking diversified exposure without selecting individual securities, which aligns with the broader pattern of institutional flows seeking efficient vehicles. The doubling of traded value in ETPs suggests that some market participants were using these instruments to express views on the market's direction while managing single-stock risk, a sign of growing sophistication in how Nigerian investors approach portfolio construction.
Bond Market Activity and New Listings
The bonds market recorded 2.294 million units worth N2.195 billion in 56 deals, a dramatic escalation from the prior week's 234,682 units worth N226.306 million in 65 deals. Unit volume rose nearly tenfold while deal count actually fell, from 65 to 56, which points to a small number of very large transactions. This pattern is characteristic of institutional fixed income activity, where a handful of block trades can move the aggregate statistics far more than numerous small retail orders ever could.
The week also brought several notable new listings that expand the market's investable universe. Rare Gems Jewellery Limited listed commercial paper under its N20 billion issuance programme on 28 October 2026, with Series 1 Tranche A and Tranche B. The Federal Government of Nigeria Savings Bonds issued in October 2026 were listed the same day, with two-year and three-year issues carrying coupons of 13.07 per cent and 14.07 per cent respectively. NBET Finance Company Plc added its Series 2 Tranche A and Tranche B seven-year 18.0 per cent fixed rate bonds due 2033 on 29 October 2026.
What the Week Signals for Investors and the Road Ahead
Interpreting this week's data requires holding two apparently contradictory facts in mind simultaneously. On one hand, the market delivered a genuine 2.86 per cent gain, volume surged dramatically, and the number of advancing stocks nearly doubled from 20 to 33. On the other, seven sectoral indices fell, decliners outnumbered gainers, and three banking stocks accounted for more than 80 per cent of all trading. Both facts are true, and any honest analysis must reconcile them rather than cherry-picking whichever supports a preferred narrative about Nigerian equities.
The reconciliation lies in recognising that the NGX's headline index is a cap-weighted construct in which a small number of large companies exercise outsized influence. When Dangote Cement rises 27.81 per cent in a week, the index rises with it regardless of what happens elsewhere. When institutional money floods into three banking majors, turnover statistics balloon regardless of the median stock's performance. The index and the turnover figures are therefore measuring something narrower than "the market" in any intuitive sense — they are measuring the behaviour of its largest and most liquid components.
Positioning for a Concentrated Market
For investors, the practical lesson is that benchmark awareness must be paired with breadth awareness. A portfolio that simply tracks the index will have captured this week's gain, but it will also carry the concentration risk that produced it. A portfolio that diversified away from the big three banks and Dangote Cement may have underperformed the headline while holding stocks that actually fell. Neither outcome is inherently right or wrong; what matters is that the choice be deliberate rather than accidental, grounded in an explicit view about whether concentration will continue to be rewarded.
The fixed income listings offer a useful counterpoint for asset allocation. With Federal Government savings bonds yielding 13.07 per cent over two years and 14.07 per cent over three, and NBET offering 18.0 per cent on seven-year paper, the risk-free and near-risk-free alternatives to equities are genuinely competitive. Investors demanding equity exposure must therefore justify it against a meaningful hurdle: the opportunity cost of holding volatile stocks rather than locking in double-digit sovereign yields is real and quantifiable, and it should inform position sizing across the portfolio.
Watchpoints for the Coming Weeks
Several indicators will determine whether this rally extends or fades. The first is whether trading volume normalises or sustains at elevated levels; a return to the prior week's 2 billion shares would suggest the surge was event-driven rather than a durable shift in participation. The second is breadth: if gainers begin consistently outnumbering decliners, the rally is broadening and becoming healthier. The third is the banking index, whose 3.42 per cent decline sits awkwardly beside the sector's trading dominance and warrants monitoring for signs of distribution by large holders.
Finally, the dividend calendar deserves attention. Zenith Bank's ex-dividend date of 26 October, with a N1.50 payout against a last close of N120.90, illustrates how corporate actions can drive short-term flows that distort weekly statistics. As other banks approach their own dividend dates, similar patterns may recur, producing volume spikes that reflect repositioning rather than changed fundamentals. Distinguishing between the two is the essential analytical discipline that separates informed interpretation from reactive headline-reading in a market as concentrated as Nigeria's.
From our network :
- The Hidden Cost of AI Convenience: Why Over-Permissioned Agents Are a Security Time BombDiscover why AI agents with excessive permissions create dangerous single points of failure, and learn how implementing least privilege principles can protect your organization from exploitation.
- Committed Mediterranean Precipitation Decline: Why Emissions Cuts Alone Cannot Restore Winter RainsNew NOAA research reveals that Mediterranean winter rains may decline irreversibly even with emissions cuts. Explore the science of committed climate change and regional impacts.
- University Language Proficiency Exams: Why Institutional Tests Demand Different Preparation Than IELTS and TOEFLDiscover why university-specific language proficiency examinations differ fundamentally from IELTS and TOEFL, and learn strategic preparation approaches for institutional assessment success.
- How AI Agents Will Change the Way We Manage Personal FinancesExplore how AI agents are transforming personal finance through automated budgeting, bill payment, and investment management, while examining the critical security protocols and governance frameworks required for safe deployment.
- CISA’s Ten-Advisory Wave: Why Generic Patching Fails in OT and How to Build Product-Specific PlaybooksCISA released ten ICS advisories in one week, exposing critical infrastructure risks. Generic patching fails in OT. Learn to build product-specific remediation playbooks.
- Forbidden Matrix Patterns and Visible Lattice Points: A Geometric DictionaryExplore how multidimensional 0–1 matrices encode geometric truths, linking forbidden patterns to visible lattice points and hypergraph theory, with applications in combinatorics and computational geometry.
- The Final Descent: How ESA Retired the Legendary Cluster Constellation After 24 Years of Space Weather ScienceAfter 24 years mapping Earth’s magnetosphere, ESA’s Cluster mission concluded with a precisely controlled reentry over the South Pacific. This analysis explores the scientific legacy, engineering decisions, and debris mitigation principles behind one of space exploration’s most responsible retirements.
- Mobile Learning and VR in English: What Global Evidence Reveals About Effective Language TechnologyA systematic review across 14 countries reveals which language-learning technologies genuinely work. Mobile learning, AI, and VR show measurable benefits when pedagogically integrated. This evidence-based guide helps educators and learners select technology that delivers real return on investment.
- Live Online English Classes for Kids: Do They Actually Reduce Anxiety?A ten-week study reveals that synchronous online English classes can significantly reduce child language anxiety while improving listening and reading skills. Discover what makes these programs effective and how parents can select the right one.
RESOURCES
- Resources will be updated soon.
- 01
- 02
- 03
- 04
- 05
- 06
- 07
- 08
0 Comments