On November 3, equity markets around the world finished the session marginally higher, and the day's defining feature was not the size of the advance but its source: a rebound in semiconductor shares that steadied a market which had spent recent sessions under visible pressure. The move was small in percentage terms, yet it carried outsized interpretive weight, because chipmakers have become the market's de facto barometer for artificial intelligence spending, data-center capital expenditure, and the durability of the current earnings cycle. When semiconductor names recover, investors read it as a signal that the broader risk appetite has not broken, even if conviction remains thin.
What makes this session instructive is its restraint. A modestly positive close, driven by a single leadership group, tells us more about market psychology than a dramatic rally would. It suggests that buyers are willing to step in at lower prices but are not yet prepared to chase strength aggressively, a posture consistent with a market that is waiting for confirmation from inflation data, central-bank commentary, and corporate guidance. The absence of granular detail in the original report is itself a useful reminder that headline summaries often compress complex cross-asset dynamics into a single sentence, and that the analytical work lies in reconstructing what those few words imply.
This analysis reconstructs that context in full. It examines why semiconductor equities have assumed systemic importance, how a narrow recovery can mask underlying breadth deterioration, what the session reveals about positioning and liquidity, and how investors should interpret modest moves that arrive without accompanying detail. The aim is not to inflate a small daily change into a grand narrative, but to treat it as a precise diagnostic reading of a market that is simultaneously resilient and fragile, confident in its leaders and uncertain about everything else.
On This Page
- The Semiconductor Sector as the Market's Structural Bellwether
- Reading a Modest Advance: Breadth, Volume, and Conviction
- Macro Backdrop: Rates, Inflation, and the Pressure That Preceded the Rebound
- Global Dimensions: Cross-Market Linkages and Currency Effects
- Positioning, Liquidity, and the Anatomy of a Relief Rally
- Practical Implications for Investors and Analysts
- Conclusion: What a Slightly Higher Close Actually Tells Us
TL;DR Global equities closed slightly higher on November 3, 2026, with a rebound in semiconductor shares doing the heavy lifting for an otherwise pressured market. The advance was modest and thinly detailed, which itself signals a market lacking broad conviction. Chip stocks function as the market's proxy for AI capital expenditure and earnings durability, so their recovery matters disproportionately. Investors should read the session as evidence of selective support rather than renewed bullish momentum, and should watch breadth, volatility, and rate expectations for confirmation before treating the move as a turning point.
The Semiconductor Sector as the Market's Structural Bellwether
Semiconductor equities occupy a position in modern portfolios that few sectors have ever matched. They sit at the intersection of consumer electronics, automotive production, industrial automation, and the enormous build-out of artificial intelligence infrastructure, which means their order books function as a real-time read on global capital expenditure intentions. When chip shares recover, the market is not merely rotating into a favored industry; it is repricing expectations for the entire technology supply chain and, by extension, for the earnings power of the index itself. That is why a modest rebound in this group can lift the broader tape even when other sectors remain subdued.
Why Chipmakers Drive Index-Level Sentiment
The concentration of index weights explains much of the phenomenon. A handful of large semiconductor and platform companies now account for a substantial share of major capitalization-weighted benchmarks, so their direction mechanically influences the headline number. Beyond mechanics, however, there is a genuine informational channel: chipmakers report order visibility earlier than most industries, and their guidance tends to lead broader technology spending by several quarters. Investors therefore treat their price action as a forward-looking indicator rather than a coincident one, which amplifies the sentiment effect of even a small daily recovery.
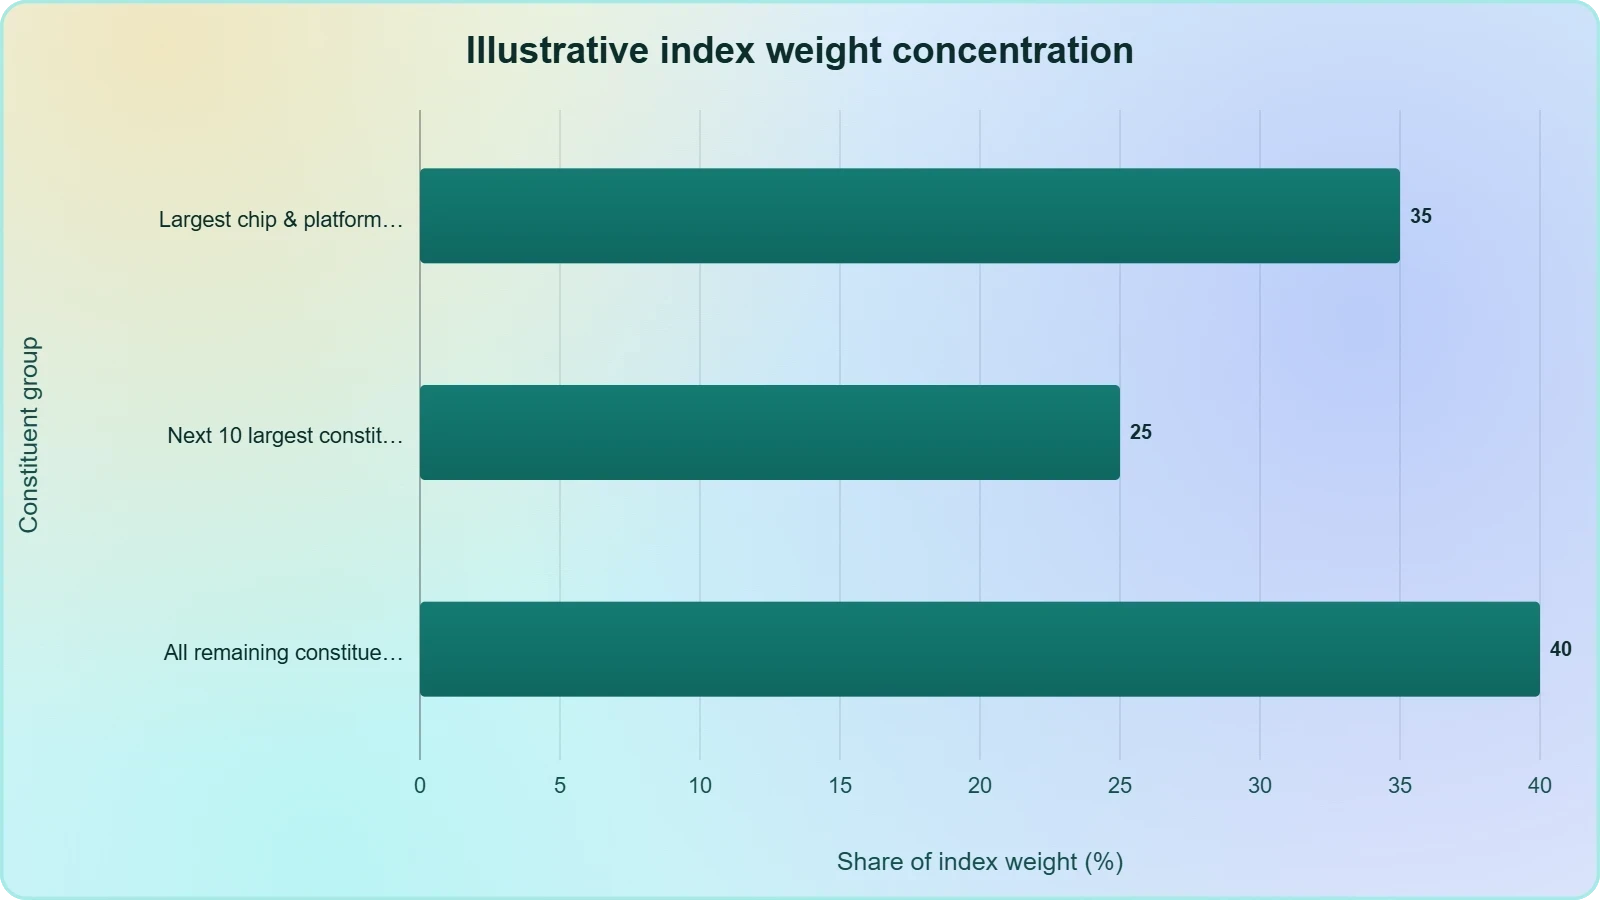
This leadership role creates a structural dependency that deserves explicit acknowledgment. When a narrow group carries the index, the market's apparent stability is contingent on the continued health of that group, and diversification benefits quietly erode. A portfolio that believes itself broadly exposed may in practice be making a concentrated wager on semiconductor demand and AI infrastructure spending. Recognizing this asymmetry is the first step toward interpreting sessions like November 3 correctly, because the recovery of chip stocks was simultaneously a genuine positive and a reminder of how much rests on a single pillar.
The AI Capital Expenditure Cycle Behind the Rebound
The rebound did not occur in a vacuum. It reflected an ongoing reassessment of the artificial intelligence capital expenditure cycle, in which hyperscale cloud providers and enterprises continue to commit enormous sums to compute infrastructure. Semiconductor suppliers are the primary beneficiaries of that spending, and their valuations embed expectations about how long the cycle can persist. Any session in which these shares recover suggests that investors, at least temporarily, judge the cycle intact rather than exhausted, a judgment that carries implications far beyond the chip sector itself.
Yet the cycle's durability remains genuinely contested. Bears argue that infrastructure spending has outpaced near-term monetization, that depreciation schedules will eventually compress margins, and that customer concentration creates fragility. Bulls counter that inference demand is still in its early innings and that each generation of models requires more compute, not less. The November 3 recovery does not resolve this debate; it merely indicates that, on that day, the bulls held the marginal bid. Investors should treat the rebound as a sentiment datapoint within a longer argument, not as a verdict.
Reading a Modest Advance: Breadth, Volume, and Conviction
A slightly higher close is a deceptively simple statement. Its meaning depends entirely on how the gain was distributed across sectors, whether volume confirmed the move, and whether volatility measures eased or tightened alongside it. When a modest advance is powered by one leadership group while defensive sectors lag, the correct interpretation is selective support rather than broad accumulation. Investors who read only the headline number risk mistaking a narrow stabilization for a durable recovery, and that misreading can lead to poorly timed increases in risk exposure just as the market's underlying fragility is being exposed.
Breadth Deterioration Beneath a Positive Close
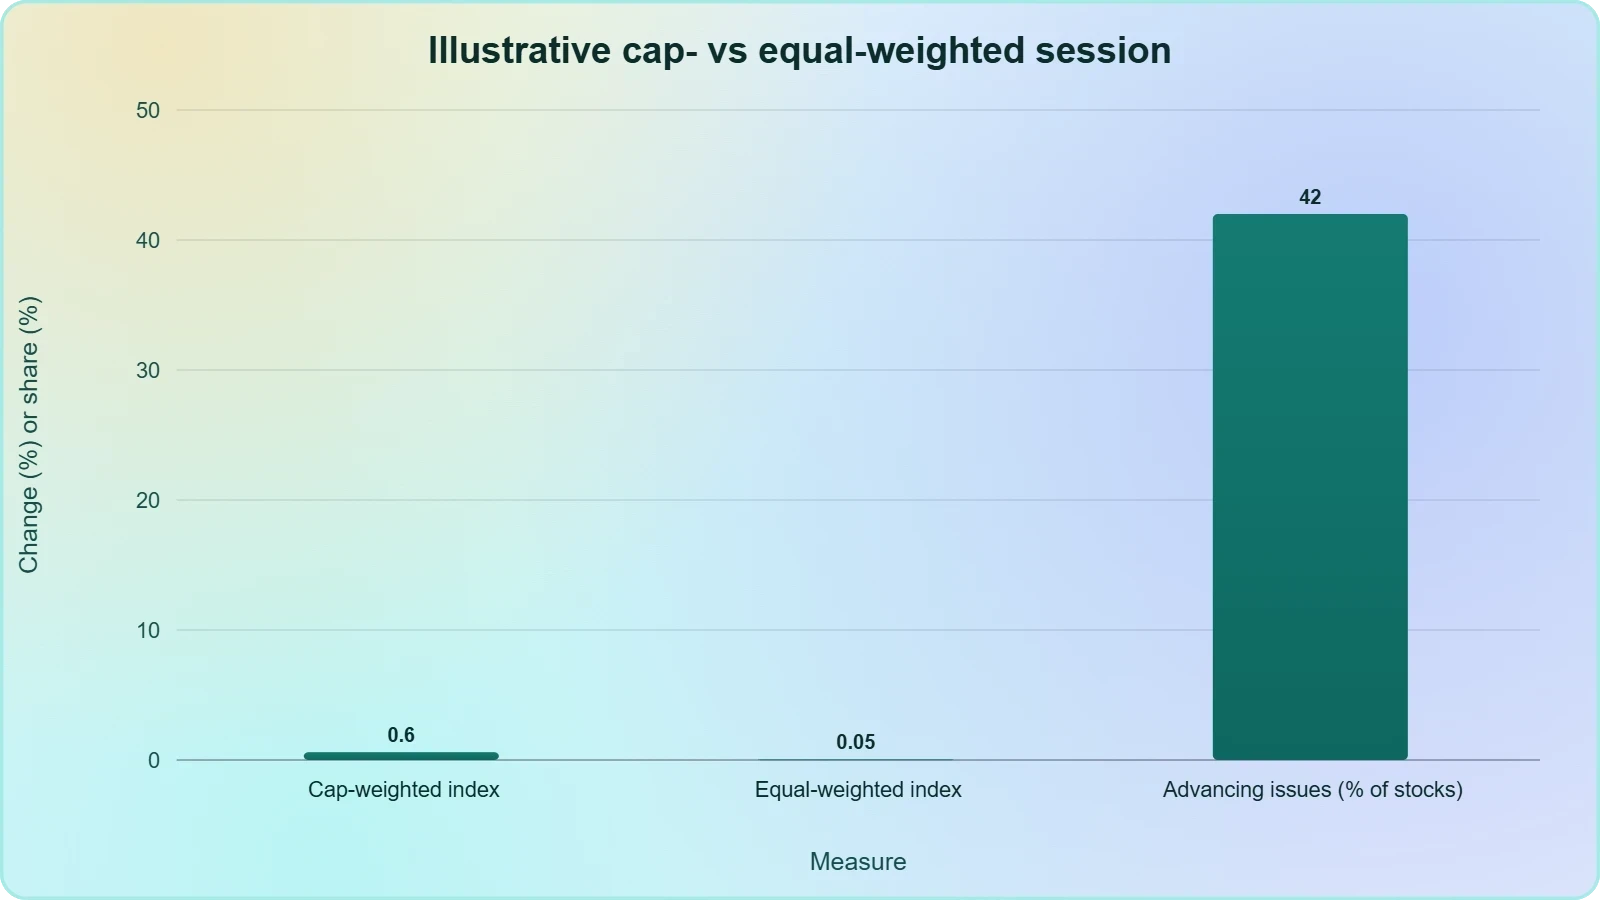
Market breadth, measured as the proportion of advancing issues or the spread between new highs and new lows, is the most reliable diagnostic for distinguishing healthy rallies from fragile ones. A session in which the index rises while more individual stocks fall is a warning, not a confirmation. Because the source report offers no breadth data, the prudent assumption is that a chip-led recovery of modest magnitude likely masked uneven participation. Analysts should treat such sessions as invitations to examine advance-decline lines, equal-weighted versus cap-weighted performance, and sector dispersion before drawing conclusions about trend strength.
The equal-weighted versus cap-weighted comparison is particularly revealing. If the cap-weighted index gains while its equal-weighted counterpart stalls or declines, the move is attributable to a small number of large companies rather than to broad-based buying. This distinction matters enormously for portfolio construction, because investors holding diversified baskets may experience none of the headline gain while bearing the same downside risk if leadership falters. The November 3 session, described only as slightly higher, should therefore prompt a deliberate check of these internal measures rather than acceptance of the surface narrative.
Volume, Volatility, and the Quality of the Bid
Volume validates price. A recovery on below-average turnover suggests that sellers simply paused rather than that buyers returned with conviction, and such moves frequently retrace. Volatility measures offer a complementary lens: if implied volatility declines alongside a modest advance, the market is pricing reduced near-term risk, whereas rising volatility during a positive session signals persistent hedging demand and underlying anxiety. Without these datapoints, the November 3 close remains ambiguous, and disciplined investors should acknowledge that ambiguity rather than resolve it prematurely in either direction.
The quality of the bid also depends on who is buying. Systematic and passive flows respond mechanically to price, while discretionary and hedge-fund positioning reflects active conviction. When a modest recovery is driven by mechanical rebalancing or short covering rather than fresh fundamental buying, its durability is limited. Distinguishing these sources requires attention to futures positioning, options skew, and fund flow data. The lesson is that a small positive close carries information only when paired with evidence about the composition of demand behind it.
We Also Published
Macro Backdrop: Rates, Inflation, and the Pressure That Preceded the Rebound
The report notes that the market had been under pressure before the chip-led recovery, and that pressure did not emerge from nowhere. Through late 2026, equity valuations remained sensitive to the path of policy rates, the persistence of services inflation, and the term premium embedded in long-dated government bonds. When discount rates are volatile, long-duration growth equities, and semiconductor names foremost among them, become the market's most rate-sensitive segment. A recovery in these shares therefore often reflects a marginal easing in rate expectations as much as any company-specific development.
The Discount-Rate Channel and Growth Valuations
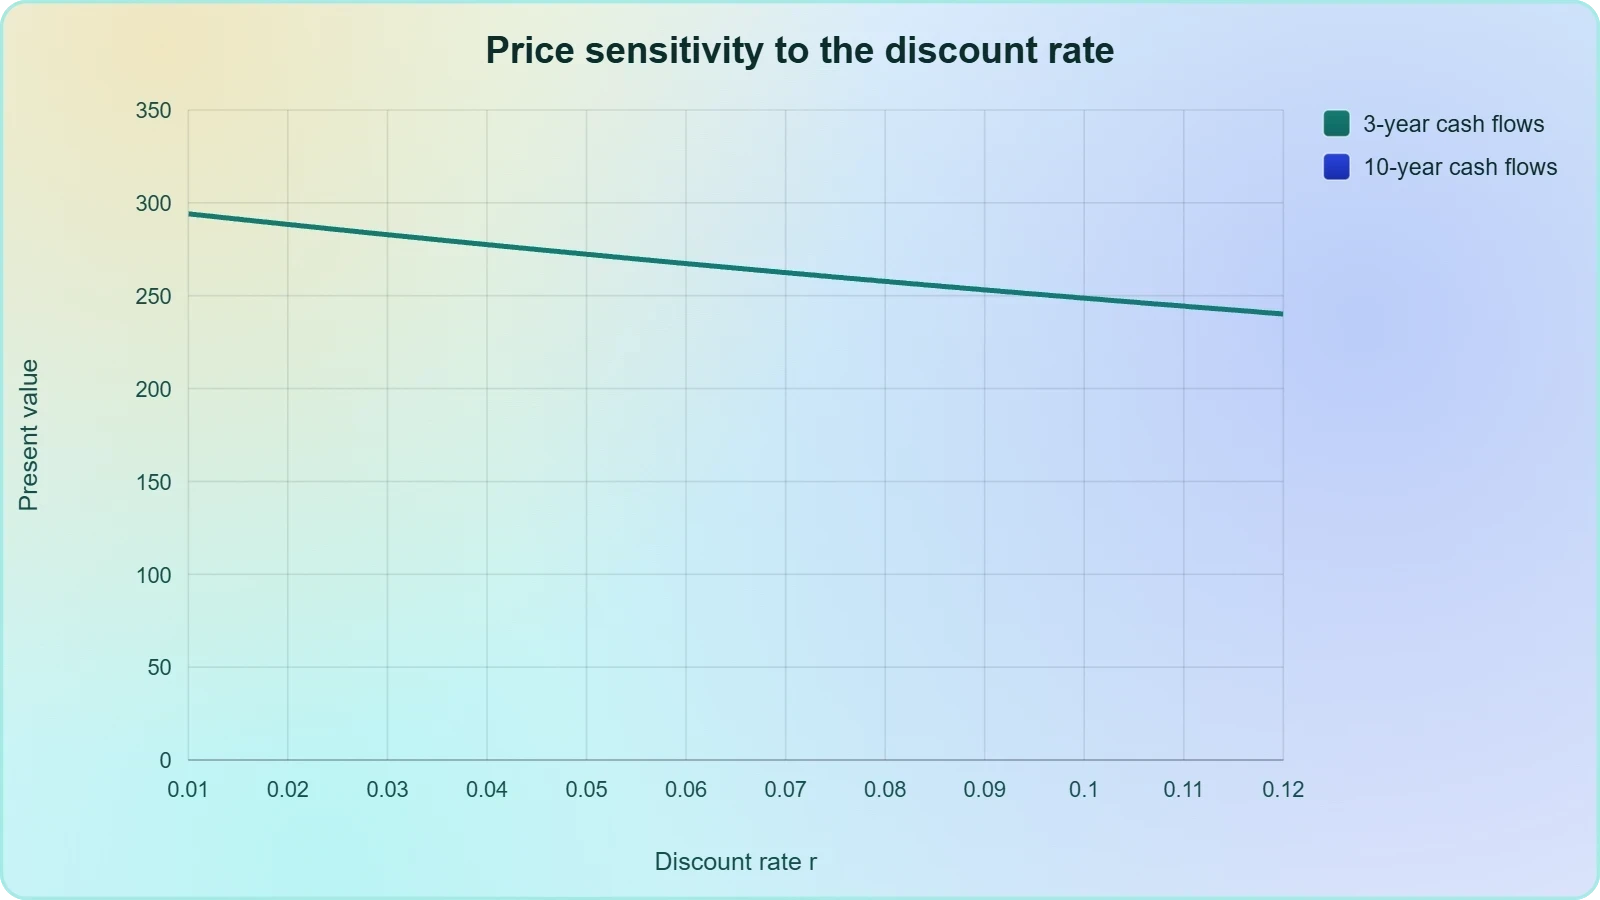
The mathematical relationship is straightforward and worth stating precisely. The present value of future cash flows is inversely related to the discount rate applied to them, and the sensitivity increases with the duration of those cash flows. Growth equities derive most of their value from distant earnings, so a small change in the risk-free rate produces a disproportionate change in their fair value. This is why semiconductor shares can rebound sharply on modest shifts in rate expectations, and why their recovery can lift the entire index without any change in fundamental outlook.
In this expression, ##CF_t## represents the cash flow expected in period ##t##, ##r## is the discount rate, and ##n## is the number of periods. The derivative of price with respect to ##r## is negative and grows in magnitude as cash flows are pushed further into the future. Investors can therefore interpret a chip-led recovery as evidence that the market's implied discount rate eased, even when no explicit rate news occurred. That inference is more analytically honest than attributing the move to vague optimism.
Inflation Data and Central-Bank Communication
Rate expectations are themselves a function of incoming inflation data and central-bank communication. In the weeks surrounding November 3, markets were parsing services inflation, wage growth, and guidance about the pace of policy normalization. Any datapoint suggesting disinflation tends to support duration-sensitive equities, while hawkish commentary does the opposite. The modest recovery in chip stocks is consistent with a market that received marginally reassuring signals, or simply with one that had already priced sufficient pessimism and found the incremental news less bad than feared.
This distinction between absolute good news and relative relief is central to interpreting daily market behavior. Markets frequently rise not because conditions improved but because expectations had fallen far enough that reality exceeded them. A slightly higher close following a period of pressure fits this pattern precisely. Investors should therefore avoid extrapolating the session into a durable trend and instead monitor the next inflation release and policy meeting for confirmation that the underlying rate environment has genuinely shifted rather than merely paused.
- 01
- 02
- 03
- 04
Global Dimensions: Cross-Market Linkages and Currency Effects
The session was global in scope, and that framing matters. Semiconductor production is among the most internationally distributed industries in existence, with design concentrated in a few economies, fabrication spread across East Asia, and equipment supply dominated by a small number of firms in Europe, Japan, and the United States. A recovery in chip equities therefore reflects coordinated expectations across multiple markets rather than a single national narrative. Currency movements add another layer, since a stronger dollar can pressure overseas earnings translations while a weaker one flatters them.
Supply-Chain Geography and Regional Exposure
Investors analyzing semiconductor exposure must map the supply chain geographically. Foundry capacity is heavily concentrated in Taiwan and South Korea, advanced lithography equipment originates largely from the Netherlands, and materials and memory production span Japan and the United States. Each node carries distinct geopolitical and regulatory risk. A global chip rebound implies that investors are collectively reassessing these risks as manageable, which is itself a meaningful signal about how the market is pricing geopolitical tail events at any given moment.
Regional equity indices reflect this geography unevenly. Export-oriented Asian markets are more directly levered to chip demand, while European indices capture equipment suppliers and, to a lesser extent, automotive semiconductor consumption. When the report describes a global session ending slightly higher, the underlying reality is a set of correlated but distinct regional moves, each driven by local positioning and currency dynamics. Understanding this heterogeneity prevents the mistake of treating global equity markets as a single homogeneous asset class.
Currency Translation and Earnings Sensitivity
Currency effects are frequently underestimated in daily market commentary. A multinational semiconductor company earning revenue in multiple currencies but reporting in dollars experiences translation effects that can meaningfully alter reported results independent of operational performance. When the dollar softens, overseas earnings translate into more dollars, providing a tailwind that can support share prices even without demand improvement. Conversely, dollar strength can suppress reported earnings and weigh on sentiment, which is one reason chip stocks often react to currency moves alongside rate expectations.
For global investors, this creates a layered exposure problem. Holding a foreign semiconductor company entails both equity risk and currency risk, and the two can offset or compound depending on the direction of the dollar. Hedging decisions therefore become part of the investment thesis rather than an afterthought. The November 3 recovery, viewed through this lens, may partly reflect currency dynamics that are invisible in a headline summary but material to the actual returns investors experience across different base currencies.
Positioning, Liquidity, and the Anatomy of a Relief Rally
Daily market moves are frequently better explained by positioning than by fundamentals. When investors have accumulated defensive hedges or reduced exposure during a period of pressure, even modest positive news can trigger a disproportionate rebound as those positions unwind. The November 3 recovery in chip stocks fits the profile of a relief rally: a market that had been under pressure, a catalyst that was incremental rather than transformative, and a gain that was real but restrained. Understanding this anatomy helps investors avoid mistaking a positioning-driven bounce for a fundamental inflection.
Short Covering and Systematic Rebalancing
Two mechanical forces commonly amplify modest recoveries. The first is short covering, in which bearish positions are closed as prices rise, creating buying pressure that is unrelated to fundamental conviction. The second is systematic rebalancing, where volatility-targeting and risk-parity strategies adjust exposures based on realized volatility, buying when volatility falls. Both forces are reflexive: they respond to price and thereby reinforce it. A chip-led recovery of modest size is exactly the kind of move these strategies can amplify, which means the observed gain may overstate the strength of discretionary demand.
Distinguishing mechanical from fundamental buying requires examining options markets, futures positioning, and fund flow data. Elevated put-to-call ratios that decline during a rally suggest hedging unwinds, while sustained call buying suggests genuine bullish conviction. Without such data, the prudent interpretation of a slightly higher close is that some combination of these forces operated, and that the durability of the move depends on whether discretionary capital follows. Investors should watch subsequent sessions for confirmation before adjusting strategic allocations.
Liquidity Conditions and Execution Quality
Liquidity shapes the character of daily moves as much as sentiment does. In thinner markets, modest order flow produces outsized price changes, and the resulting volatility can mislead observers about underlying conviction. Semiconductor shares are generally among the most liquid equities, but liquidity varies by venue, time of day, and market conditions. A recovery that occurs on light volume may reflect a temporary imbalance rather than a durable shift in demand, and investors executing large orders should account for this when interpreting the session's signal.
Execution quality also matters for the returns investors actually capture. Slippage, bid-ask spreads, and market impact can erode the benefit of a modest index gain, particularly for strategies that trade frequently. The headline close describes a theoretical price, not the price available to a large buyer or seller. Sophisticated investors therefore treat daily index moves as context rather than as actionable signals, focusing instead on structural trends and valuation that persist beyond the noise of any single session.
Practical Implications for Investors and Analysts
The practical lesson of a session like November 3 is that headline summaries are starting points, not conclusions. Investors who act on a single sentence describing a slightly higher close, without examining breadth, volume, positioning, and macro context, are effectively trading on noise. The disciplined approach is to treat each session as a datapoint within a framework, asking what it confirms, what it contradicts, and what remains unknown. That framework transforms a thin report into a structured inquiry about market state and portfolio resilience.
Building a Monitoring Framework
A robust monitoring framework tracks a small set of high-information indicators rather than reacting to every daily move. Breadth measures reveal participation, volatility indices capture risk pricing, credit spreads signal stress in financing conditions, and rate expectations anchor valuation. Semiconductor leadership deserves a dedicated line because of its systemic weight. When these indicators align, the signal is meaningful; when they diverge, the appropriate response is patience. The framework's value lies not in prediction but in preventing reactive decisions driven by incomplete information.
Documentation strengthens the framework considerably. Recording what was observed, what was inferred, and what was assumed creates an audit trail that improves judgment over time. Investors who note that a modest recovery occurred on light volume with narrow breadth, and who later observe the move retracing, build intuition that no single report can provide. This practice converts daily market noise into accumulated expertise, and it is the most reliable way to extract durable value from the steady stream of abbreviated market summaries.
Portfolio Construction Under Concentration Risk
Concentration risk deserves explicit treatment in portfolio construction. If semiconductor leadership drives index returns, then a portfolio that appears diversified by sector may still be concentrated by factor exposure. Investors should measure their effective exposure to AI capital expenditure, duration sensitivity, and semiconductor demand, and should consider whether that exposure aligns with their risk tolerance and time horizon. Hedging or trimming is not a prediction of decline; it is an acknowledgment that concentrated leadership creates asymmetric downside when sentiment shifts.
Rebalancing discipline provides a practical mechanism. When leadership drives a sector's weight above target, systematic trimming restores balance and locks in gains, while periods of underperformance create opportunities to add. This mechanical approach avoids the emotional difficulty of selling winners and buying losers, and it ensures that portfolio risk remains aligned with stated objectives. The November 3 session, modest as it was, is a reminder that leadership rotates and that portfolios built around a single theme require active maintenance to remain resilient.
Conclusion: What a Slightly Higher Close Actually Tells Us
The November 3 session, described in a single sentence, contains more information than its brevity suggests. It tells us that a market under pressure found support in its most important leadership group, that the support was sufficient to lift the index but not to generate broad conviction, and that the underlying macro conditions driving that pressure had not decisively changed. Read carefully, the session is a portrait of a market in equilibrium between resilience and fragility, where the marginal buyer is present but cautious and where leadership remains narrow.
For investors, the appropriate response is neither celebration nor alarm but disciplined observation. The recovery in semiconductor shares is a genuine positive signal about the durability of AI-driven demand expectations, yet its modest magnitude and narrow base counsel against extrapolating a trend. The most valuable takeaway is methodological: daily market summaries are compressed artifacts that reward careful reconstruction, and the investors who build frameworks for that reconstruction will consistently outperform those who react to headlines alone.
Ultimately, the meaning of a slightly higher close depends on the questions we ask of it. Asked superficially, it yields a number. Asked rigorously, it yields insight into positioning, rate sensitivity, sector concentration, and the psychology of a market that has been tested and has not broken. That is the analytical standard worth holding, and it is why even the thinnest market report can serve as a useful entry point into the deeper structures that govern how capital is priced, allocated, and protected across global markets.
From our network :
- How AI Agents Will Change the Way We Manage Personal FinancesExplore how AI agents are transforming personal finance through automated budgeting, bill payment, and investment management, while examining the critical security protocols and governance frameworks required for safe deployment.
- Live Online English Classes for Kids: Do They Actually Reduce Anxiety?A ten-week study reveals that synchronous online English classes can significantly reduce child language anxiety while improving listening and reading skills. Discover what makes these programs effective and how parents can select the right one.
- Forbidden Matrix Patterns and Visible Lattice Points: A Geometric DictionaryExplore how multidimensional 0–1 matrices encode geometric truths, linking forbidden patterns to visible lattice points and hypergraph theory, with applications in combinatorics and computational geometry.
- Committed Mediterranean Precipitation Decline: Why Emissions Cuts Alone Cannot Restore Winter RainsNew NOAA research reveals that Mediterranean winter rains may decline irreversibly even with emissions cuts. Explore the science of committed climate change and regional impacts.
- The Hidden Cost of AI Convenience: Why Over-Permissioned Agents Are a Security Time BombDiscover why AI agents with excessive permissions create dangerous single points of failure, and learn how implementing least privilege principles can protect your organization from exploitation.
- The Final Descent: How ESA Retired the Legendary Cluster Constellation After 24 Years of Space Weather ScienceAfter 24 years mapping Earth’s magnetosphere, ESA’s Cluster mission concluded with a precisely controlled reentry over the South Pacific. This analysis explores the scientific legacy, engineering decisions, and debris mitigation principles behind one of space exploration’s most responsible retirements.
- CISA’s Ten-Advisory Wave: Why Generic Patching Fails in OT and How to Build Product-Specific PlaybooksCISA released ten ICS advisories in one week, exposing critical infrastructure risks. Generic patching fails in OT. Learn to build product-specific remediation playbooks.
- University Language Proficiency Exams: Why Institutional Tests Demand Different Preparation Than IELTS and TOEFLDiscover why university-specific language proficiency examinations differ fundamentally from IELTS and TOEFL, and learn strategic preparation approaches for institutional assessment success.
- Mobile Learning and VR in English: What Global Evidence Reveals About Effective Language TechnologyA systematic review across 14 countries reveals which language-learning technologies genuinely work. Mobile learning, AI, and VR show measurable benefits when pedagogically integrated. This evidence-based guide helps educators and learners select technology that delivers real return on investment.
RESOURCES
- Resources will be updated soon.
- 01
- 02
- 03
- 04
- 05
- 06
- 07
- 08
0 Comments