When The New York Times runs a banner headline as spare and declarative as “America Votes,” the newsroom is not merely reporting an event; it is signalling that the machinery of American self-government has been set in motion once again. The November 3, 2026 midterm elections represent the constitutional heartbeat of a republic that has, for nearly two and a half centuries, entrusted its direction to the ballot rather than the sword. Every cycle carries its own weather, but the structural significance of this particular vote extends well beyond the personalities on the ticket.
What the source material captures is deceptively minimal: a timestamp, a global dateline, and a single sentence confirming that the United States is holding elections. Yet that brevity is itself instructive. In a media environment saturated with prediction models, exit-poll speculation, and minute-by-minute punditry, the plainest possible statement of fact remains the most consequential. A nation of roughly 340 million people is deciding who will sit in the House of Representatives, who will occupy a third of the Senate, and which governors, attorneys general, and state legislators will shape policy for years to come.
This analysis examines the deeper architecture beneath that headline. It considers the constitutional design that makes midterm elections a referendum on presidential power, the mechanics of how votes become seats, the economic signals markets read into divided government, and the information ecosystem through which citizens now interpret results. The aim is not to forecast outcomes but to explain the structures that make outcomes meaningful, and to give readers a durable framework for understanding why an election night in November matters long after the last county reports its tally.
On This Page
- The Constitutional Architecture of a Midterm Election
- How Votes Become Seats: The Mechanics of Representation
- The Presidential Referendum and the Midterm Penalty
- Markets, Policy, and the Economics of Divided Government
- Information, Misinformation, and the Modern Election Night
- Global Reverberations of an American Vote
- Reading the Result: A Framework for Interpretation
TL;DR The November 3, 2026 United States elections, reported by The New York Times under the headline “America Votes,” represent a midterm cycle in which the entire House, roughly a third of the Senate, and thirty-six governorships are contested. Midterms historically function as a referendum on the sitting president, and the structural forces at play — reapportionment, turnout asymmetry, and divided government — determine far more than any single race. This analysis unpacks the constitutional machinery, the seat mathematics, the market implications, and the information environment surrounding the vote, offering a framework for interpreting results rather than predicting them.
The Constitutional Architecture of a Midterm Election
The American electoral calendar is not arbitrary. Article I of the Constitution fixes House terms at two years and Senate terms at six, deliberately staggering the two chambers so that the entire House faces voters every cycle while only about one-third of the Senate does. This design forces representatives into near-permanent campaign mode and gives senators a longer horizon, a structural tension the Framers intended as a check on impulsive majoritarianism. When voters go to the polls in a midterm year, they are participating in a mechanism engineered for friction, not efficiency.
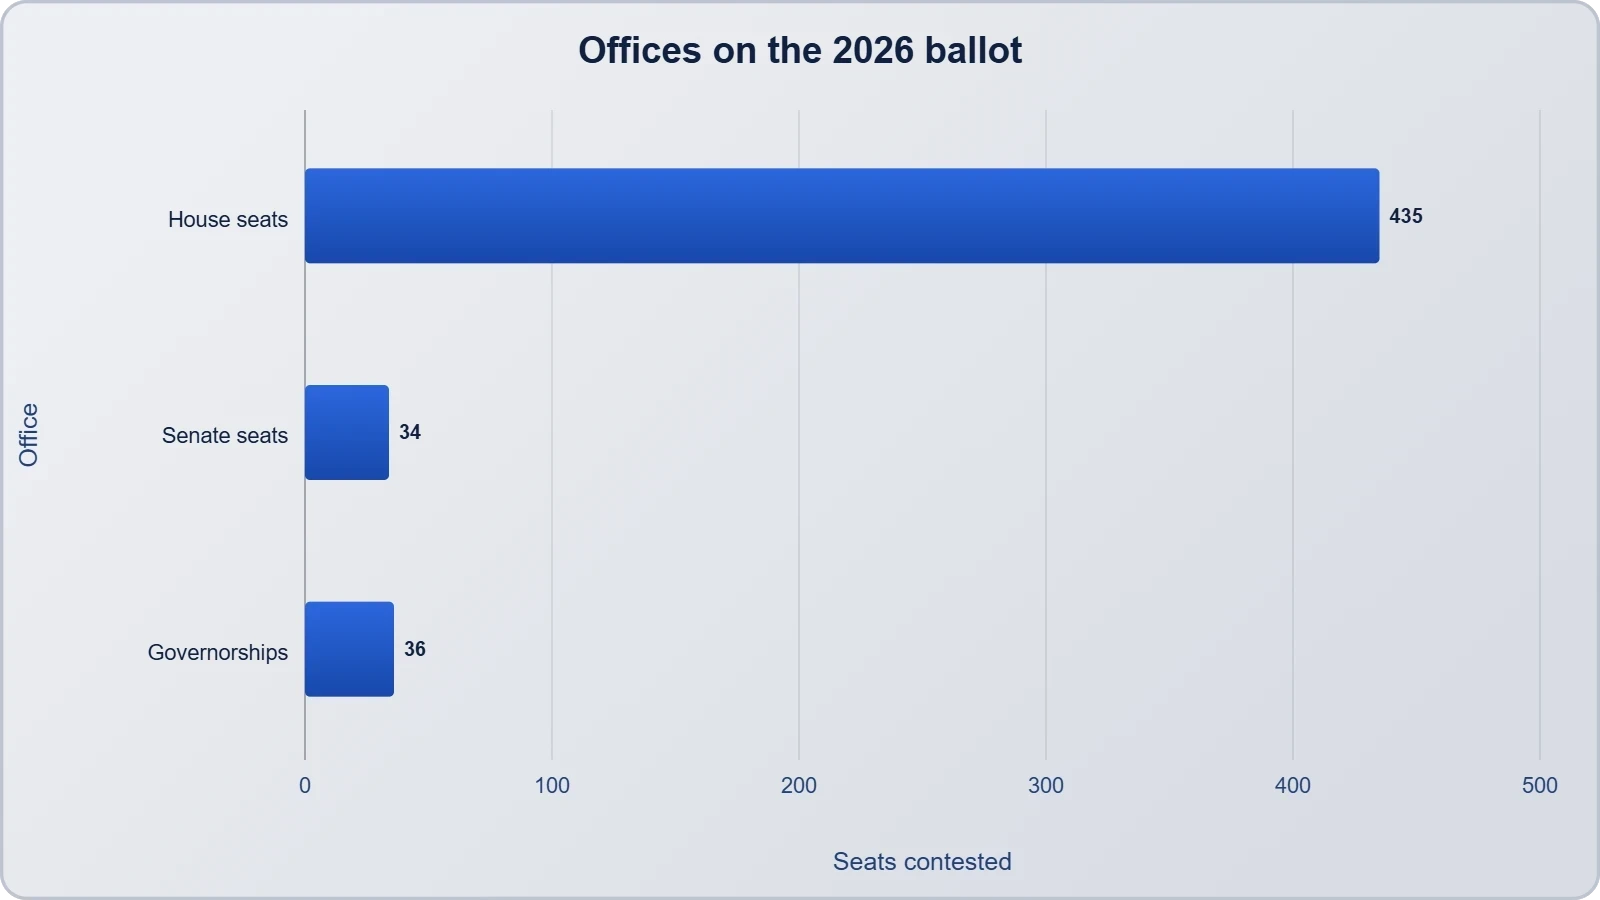
The 2026 cycle follows this template precisely. All 435 House seats are in play, alongside 33 or 34 Senate seats depending on special elections, and 36 gubernatorial contests. State legislative chambers, thousands of local offices, and a constellation of ballot initiatives ride on the same ballot. The result is an election that is simultaneously national in its rhetoric and intensely local in its mechanics, a duality that confounds simple narratives and rewards careful structural reading.
Separation of Powers as an Electoral Engine
The separation of powers is often described as a legal doctrine, but it operates most powerfully as an electoral one. Because the executive and legislative branches are elected on different clocks, voters can register dissatisfaction with one branch without dismantling the other. Midterm elections institutionalise this corrective impulse. Historically, the president’s party has lost House seats in nearly every midterm since the Civil War, a pattern so consistent that political scientists treat it as a structural feature rather than a partisan accident.
This does not mean outcomes are predetermined. The magnitude of the swing varies enormously with economic conditions, presidential approval, redistricting, and the quality of individual candidates. But the underlying logic holds: midterms are the electorate’s scheduled opportunity to apply a brake. Understanding this asymmetry is essential to interpreting any result, because a modest loss for the governing party may represent a strong performance, while a modest gain may signal deep vulnerability.
Federalism and the Subnational Stakes
Gubernatorial and state legislative races rarely dominate national coverage, yet they determine outcomes that touch daily life more directly than most federal legislation. Governors shape education funding, public health policy, infrastructure priorities, and the administration of elections themselves. State legislatures draw congressional maps, ratify constitutional amendments, and set the rules under which future federal contests are conducted. In this sense, the midterm ballot is a layered instrument, and the down-ballot results often outlast the headline races.
The 2026 cycle is no exception. With thirty-six governorships contested, the partisan balance of statehouses could shift in ways that reshape national politics for a decade. Redistricting cycles, criminal justice reform, energy policy, and reproductive rights all flow through state capitols. Voters who focus exclusively on Washington miss the level of government where structural power is most concentrated and most durable.
We Also Published
How Votes Become Seats: The Mechanics of Representation
A vote is an instruction, but the translation of instructions into seats is governed by rules that vary dramatically across jurisdictions. The United States uses single-member districts for Congress, meaning the candidate with the most votes in each district wins, regardless of margin. This plurality system tends to produce two dominant parties and amplifies small shifts in the popular vote into larger swings in seat counts. A two-point national shift can, under the right geographic distribution, translate into dozens of House seats changing hands.
Senate elections add another layer. Because each state elects two senators regardless of population, the chamber’s composition reflects land as much as people. Wyoming and California hold equal Senate representation despite a population gap of roughly sixty-eight to one. This malapportionment is a deliberate constitutional compromise, but its consequences are profound: a Senate majority can be assembled from states containing a minority of the national population. Any analysis of midterm results must account for this structural asymmetry.
Redistricting and the Geography of Competition
House districts are redrawn every ten years following the census, and the 2026 cycle is the third conducted under maps drawn after the 2020 count. In most states, legislatures control the process, which means the party holding state power can shape the terrain on which future elections are fought. The result is a landscape where the vast majority of districts are safely partisan, and a relatively small number of competitive seats determine control of the chamber. This concentration of consequence is a defining feature of modern American elections.
Reformers have pushed for independent commissions in several states, and their effect on competitiveness is measurable but uneven. Where commissions operate, the number of genuinely contested districts tends to rise. Where legislatures retain control, safe seats proliferate. The practical implication for voters is that most House races are decided in primaries rather than general elections, which shifts the ideological centre of gravity toward the activist bases of each party.
Turnout, Timing, and the Composition of the Electorate
Midterm turnout has historically lagged presidential turnout by a substantial margin, though the gap narrowed in 2018 and 2022. The composition of the midterm electorate skews older, wealthier, and more politically engaged than the presidential electorate, a demographic tilt that favours Republicans in recent cycles but is not immutable. Early voting, mail balloting, and automatic registration have altered the mechanics of participation, and the partisan effects of those changes remain contested among analysts.
Timing matters as much as composition. Vote-by-mail and early in-person voting now stretch election day into an election season, which means results often arrive in waves rather than a single night. States differ in whether they process ballots before or after polls close, producing the phenomenon of “red mirages” and “blue shifts” that can fuel misinformation. Understanding these procedural differences is essential to reading early returns accurately and resisting premature conclusions.
The Presidential Referendum and the Midterm Penalty
No structural feature of American midterms is more reliable than the so-called presidential penalty. Since the mid-twentieth century, the party occupying the White House has lost House seats in all but a handful of midterm cycles. The pattern is not a law of physics, but it is robust enough that political scientists model it as a baseline expectation. The mechanism is intuitive: midterms allow voters to express dissatisfaction with the incumbent administration without the cost of removing it entirely, a low-stakes corrective that suits the electorate’s risk aversion.
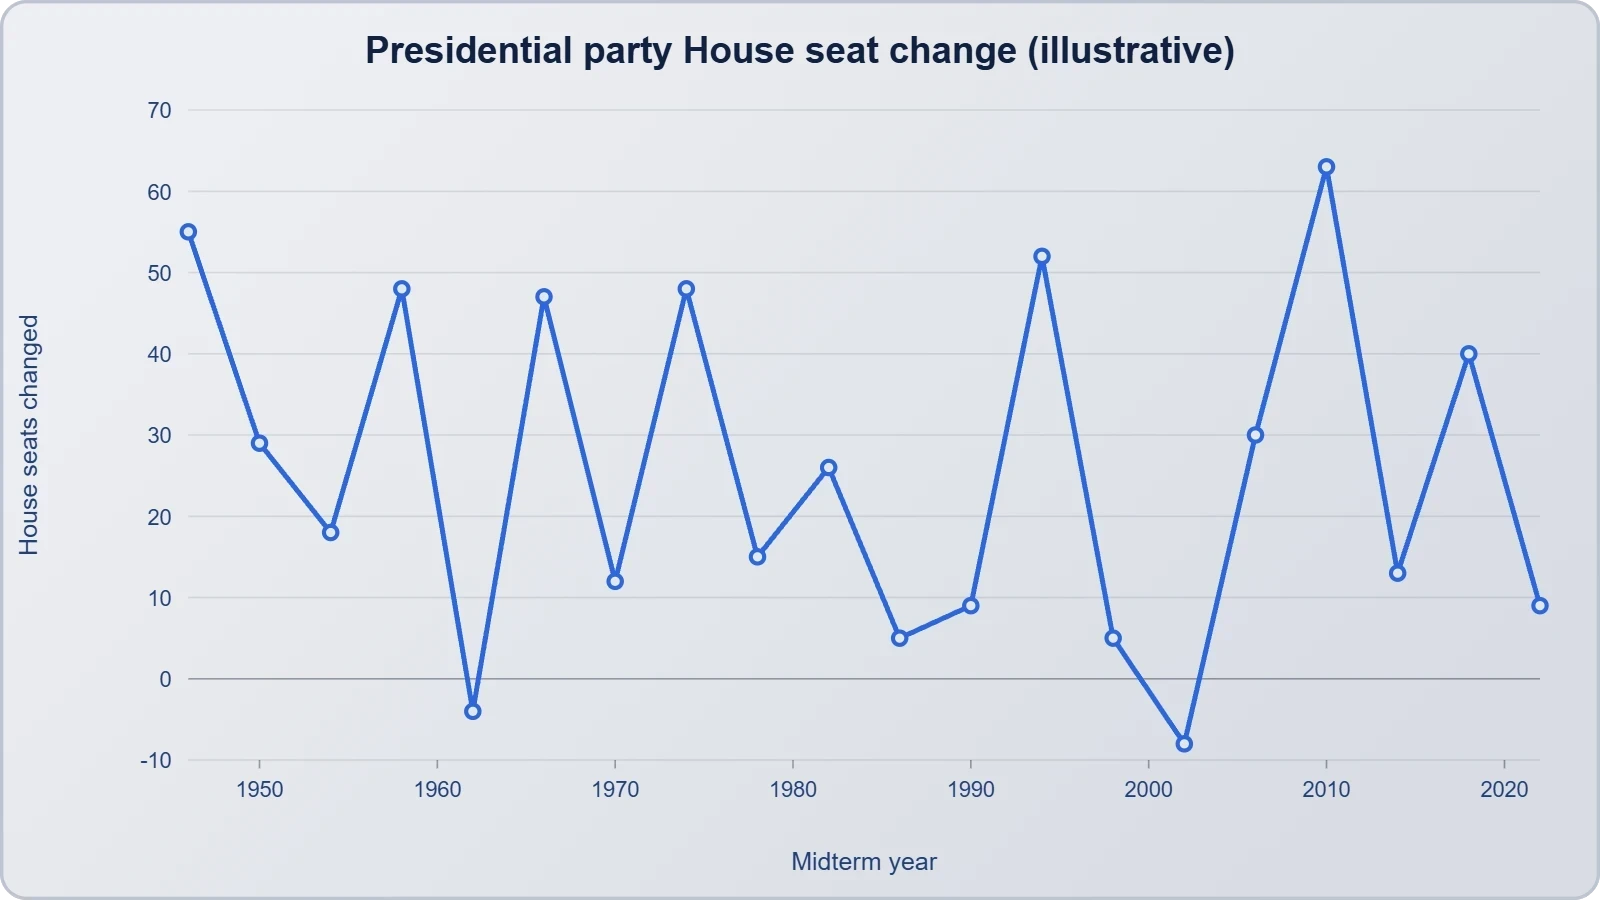
The size of the penalty depends on conditions that are observable in advance. Presidential approval ratings, real disposable income growth, the number of seats the governing party already holds, and the ideological composition of the districts being contested all matter. When approval is high and the economy is strong, the penalty shrinks; when either falters, it expands. The 2026 cycle will be read through this lens, and the magnitude of any loss will be interpreted as a verdict on the administration’s first two years.
Approval Ratings as Leading Indicators
Presidential approval is the single most scrutinised variable in midterm forecasting, and for good reason. It aggregates public sentiment across the economy, foreign policy, and cultural flashpoints into a single number that correlates strongly with seat losses. Analysts typically examine approval in the months before the election rather than on election day itself, because voters form impressions over time and rarely revise them in the final fortnight. A president hovering near or below forty percent approval historically presages meaningful losses.
Yet approval is an imperfect instrument. It measures sentiment toward a person, not toward a party’s legislative record, and it can be distorted by polarisation. In a deeply divided electorate, a president may retain near-universal support within his own coalition while facing near-universal opposition outside it, producing a stable but uninformative number. The most useful readings combine approval with measures of intensity and with the public’s assessment of the economy, which often moves independently.
Economic Conditions and the Pocketbook Vote
Voters consistently rank the economy among their top concerns, and midterm outcomes reflect that priority. Real wage growth, inflation, unemployment, and the cost of housing all feed into a diffuse sense of whether the country is on the right track. When households feel squeezed, the governing party pays a price, regardless of whether its policies are causally responsible. This pocketbook logic is one of the most durable findings in political behaviour research, and it operates with particular force in midterms where turnout is lower and economic messaging dominates.
The 2026 environment will be shaped by whatever economic conditions prevail in the autumn of that year, which cannot be known in advance. What can be said is that the relationship between economic sentiment and electoral outcomes is asymmetric: voters punish perceived mismanagement more readily than they reward competence. A strong economy may blunt the presidential penalty, but it rarely reverses it entirely. This asymmetry is a structural feature of democratic accountability, not a partisan observation.
- 01
- 02
- 03
- 04
Markets, Policy, and the Economics of Divided Government
Financial markets do not vote, but they price the consequences of votes with remarkable speed. Election-night futures moves, sector rotations, and currency fluctuations all encode investors’ expectations about taxation, regulation, and spending. The dominant variable is not which party wins but how much power it consolidates. Divided government, in which control of the presidency and the two chambers is split, tends to produce gridlock, and gridlock is often priced as stability because it forecloses abrupt policy change.
This is not a partisan claim but an empirical regularity. Markets have historically responded favourably to divided government because it reduces the probability of large fiscal expansions or contractions, and because it preserves the status quo in regulatory regimes. The corollary is that unified government, whatever its ideological direction, introduces variance. Investors may welcome a unified government that promises tax cuts and deregulation, or fear one that promises higher taxes and tighter oversight. The direction matters, but the magnitude of uncertainty is what moves prices first.
Sector Rotation and Regulatory Anticipation
Different industries carry different sensitivities to electoral outcomes. Energy, healthcare, financial services, and technology all face distinct regulatory environments that shift with the balance of power in Washington. When one party sweeps, analysts revise earnings models for affected sectors within hours. When gridlock is expected, those revisions are smaller. The practical effect is that election night produces a burst of sector-specific volatility that often fades as the policy reality becomes clearer over subsequent weeks.
Sophisticated investors watch committee chairmanships as closely as they watch the presidency. A change in control of a single chamber can shift the agenda on antitrust enforcement, drug pricing, or bank capital rules, even if the White House remains unchanged. These downstream effects are frequently underestimated in headline coverage, which tends to focus on the marquee races. For anyone with capital at stake, the composition of committees and the identity of their chairs is often more consequential than the top-line result.
Fiscal Policy, Debt, and the Bond Market
The bond market’s reaction to elections is a useful barometer of fiscal expectations. When voters deliver unified government with a mandate for spending or tax cuts, yields often rise on expectations of larger deficits. When they deliver divided government, yields tend to be steadier. The relationship is not mechanical, because monetary policy, inflation, and global capital flows all intervene, but the direction is consistent enough to be informative. In 2026, with debt levels elevated and interest costs consuming a growing share of the federal budget, the fiscal signal will be watched closely.
This creates a paradox for voters. Policies that are popular in the short run, such as tax cuts or expanded benefits, can raise borrowing costs and crowd out private investment over time. Markets price this trade-off continuously, even when politicians do not articulate it. The result is that election outcomes carry an implicit fiscal message that is transmitted through yields, credit spreads, and currency values long before legislation is drafted. Understanding this transmission channel is essential to reading the full meaning of an election result.
Information, Misinformation, and the Modern Election Night
The headline “America Votes” arrives not in a vacuum but in a media ecosystem radically different from the one that shaped twentieth-century elections. Results now flow through a layered network of official counts, network projections, social media feeds, and partisan commentary, each operating on different timelines and with different incentives. The consequence is that citizens often encounter conflicting narratives about the same event within minutes of polls closing, and the resolution of those conflicts can take days or weeks.
This environment places a premium on source literacy. The New York Times, as the source of the original report, represents one node in a broader information graph that includes the Associated Press, state election officials, and independent analysts. Understanding which sources are authoritative for which claims, and which are merely interpretive, is now a civic skill as essential as knowing where one’s polling place is located. The mechanics of verification have become part of the election itself.
The Anatomy of an Election-Night Call
When a network “calls” a race, it is not reporting a final count but making a statistical judgment that the remaining uncounted votes cannot plausibly alter the outcome. This distinction is frequently lost in public discourse, leading to confusion when later tallies shift margins without changing results. The major decision desks use models that incorporate historical patterns, geographic returns, and the partisan composition of outstanding precincts. Their calls are probabilistic, not prophetic, and they occasionally err.
The rise of mail voting has complicated this calculus. States that process ballots after election day can report large batches late, producing shifts that look suspicious to observers unfamiliar with the procedure but are entirely routine. Election administrators have tried to address this by expanding pre-processing and public education, but the gap between procedural reality and public perception remains a persistent vulnerability. Misunderstanding of legitimate process is one of the most common sources of false fraud claims.
Trust, Verification, and the Civic Commons
Public confidence in elections is a collective good, sustained by transparency, bipartisan oversight, and a shared commitment to accepting results that one’s side did not prefer. When that confidence erodes, the costs are borne by everyone: higher litigation, reduced participation, and a coarsening of political discourse. The 2026 cycle will test these foundations, as every recent cycle has, and the response of institutions, media, and citizens will determine whether the erosion is arrested or accelerated.
Verification infrastructure has improved in recent years. Paper trails, risk-limiting audits, and post-election reviews are now standard in many jurisdictions, and their results are publicly documented. The challenge is not the absence of evidence but its distribution. Citizens who encounter claims of irregularities can now check them against official audit reports, a practice that was far more difficult two decades ago. The tools for trust exist; the question is whether they are used.
Global Reverberations of an American Vote
The dateline on the source report reads “Global,” and that is not incidental. American elections are global events because the United States anchors the international monetary system, underwrites a network of security alliances, and sets the tone for trade policy across continents. A shift in congressional control can alter the trajectory of sanctions, tariff regimes, climate commitments, and military assistance. Foreign capitals read American midterms with the same attention that markets do, and for many of the same reasons.
The transmission mechanisms are varied. A Congress hostile to a sitting president may block or condition aid packages, reshaping conflicts abroad. A change in committee leadership can stall trade agreements or accelerate them. Domestic energy policy affects global prices. Even the tone of campaign rhetoric signals the durability of commitments, which allies and adversaries alike factor into their strategic planning. The result is that a vote cast in Ohio or Arizona carries implications for Seoul, Berlin, and Riyadh.
Alliances, Trade, and Strategic Signaling
Alliances depend on credibility, and credibility depends on continuity. When one party controls the presidency and the other controls at least one chamber, foreign partners must assess whether commitments will survive the next budget cycle. This uncertainty is not new, but it has intensified as partisan divergence on foreign policy has grown. The 2026 results will be parsed for signals about the durability of security guarantees, the trajectory of trade negotiations, and the willingness to fund international institutions.
Trade policy is particularly sensitive to legislative composition. Tariffs, export controls, and investment screening all require statutory authority or congressional acquiescence, and a chamber controlled by the opposing party can constrain executive action. For exporting nations, the practical question is not who wins but what legislation becomes possible. The answer shapes supply chains, capital flows, and the calculus of multinational firms deciding where to build their next factory.
Currency, Commodities, and Emerging Markets
The dollar’s role as the world’s reserve currency means that American political developments transmit directly into global financial conditions. A fiscal expansion that raises Treasury yields can tighten financial conditions for emerging markets, while a shift toward fiscal restraint can ease them. Commodity prices respond to expected changes in regulation and infrastructure spending. These channels operate continuously, but election nights concentrate them into sharp, observable moves that reveal how the world is pricing American politics.
Emerging markets are especially exposed. Countries with large dollar-denominated debt watch American yields closely, because rising yields increase their servicing costs and can trigger capital outflows. Political uncertainty in Washington adds a risk premium that compounds these effects. For policymakers in these economies, the American midterm is not a distant spectacle but a variable in their own macroeconomic management, one they cannot control but must anticipate.
Reading the Result: A Framework for Interpretation
The most useful posture toward any election result is neither triumphalism nor despair but disciplined interpretation. A result is a data point, not a verdict on the nation’s soul. The framework begins with the structural baseline: given the president’s approval, the economy, and the seats already held, what would a normal outcome look like? Deviations from that baseline are where the real information lies, because they reveal shifts in turnout, coalition composition, or candidate quality that aggregate totals obscure.
The second step is disaggregation. National vote totals mask enormous regional variation, and the story of an election often lives in the suburbs, in specific demographic groups, or in the gap between presidential and down-ballot performance. Analysts who examine only the headline number miss the texture that predicts future cycles. The third step is temporal: results should be read against the previous two or three cycles to distinguish durable trends from cyclical noise. A single election is a snapshot; a sequence is a trajectory.
Finally, interpretation must account for the limits of what elections can accomplish. The American system was designed to frustrate rapid change, and its checks are working as intended when majorities find their ambitions constrained. This is not a defect to be lamented but a feature to be understood. The 2026 midterms will produce winners and losers, but their deeper meaning lies in what they reveal about the durability of institutions, the health of public trust, and the capacity of a continental republic to govern itself through peaceful, contested, and legitimate means.
From our network :
- Mobile Learning and VR in English: What Global Evidence Reveals About Effective Language TechnologyA systematic review across 14 countries reveals which language-learning technologies genuinely work. Mobile learning, AI, and VR show measurable benefits when pedagogically integrated. This evidence-based guide helps educators and learners select technology that delivers real return on investment.
- CISA’s Ten-Advisory Wave: Why Generic Patching Fails in OT and How to Build Product-Specific PlaybooksCISA released ten ICS advisories in one week, exposing critical infrastructure risks. Generic patching fails in OT. Learn to build product-specific remediation playbooks.
- The Final Descent: How ESA Retired the Legendary Cluster Constellation After 24 Years of Space Weather ScienceAfter 24 years mapping Earth’s magnetosphere, ESA’s Cluster mission concluded with a precisely controlled reentry over the South Pacific. This analysis explores the scientific legacy, engineering decisions, and debris mitigation principles behind one of space exploration’s most responsible retirements.
- How AI Agents Will Change the Way We Manage Personal FinancesExplore how AI agents are transforming personal finance through automated budgeting, bill payment, and investment management, while examining the critical security protocols and governance frameworks required for safe deployment.
- Live Online English Classes for Kids: Do They Actually Reduce Anxiety?A ten-week study reveals that synchronous online English classes can significantly reduce child language anxiety while improving listening and reading skills. Discover what makes these programs effective and how parents can select the right one.
- Committed Mediterranean Precipitation Decline: Why Emissions Cuts Alone Cannot Restore Winter RainsNew NOAA research reveals that Mediterranean winter rains may decline irreversibly even with emissions cuts. Explore the science of committed climate change and regional impacts.
- The Hidden Cost of AI Convenience: Why Over-Permissioned Agents Are a Security Time BombDiscover why AI agents with excessive permissions create dangerous single points of failure, and learn how implementing least privilege principles can protect your organization from exploitation.
- University Language Proficiency Exams: Why Institutional Tests Demand Different Preparation Than IELTS and TOEFLDiscover why university-specific language proficiency examinations differ fundamentally from IELTS and TOEFL, and learn strategic preparation approaches for institutional assessment success.
- Forbidden Matrix Patterns and Visible Lattice Points: A Geometric DictionaryExplore how multidimensional 0–1 matrices encode geometric truths, linking forbidden patterns to visible lattice points and hypergraph theory, with applications in combinatorics and computational geometry.
RESOURCES
- Resources will be updated soon.
- 01
- 02
- 03
- 04
- 05
- 06
- 07
- 08
0 Comments