When The New York Times runs an analysis under its DealBook banner asking whether Democrats can deliver a strong nationwide election showing, the question is never purely political. It is simultaneously a question about capital allocation, consumer confidence, regulatory expectation, and the pricing of uncertainty itself. The framing matters enormously: the paper does not issue a forecast or an endorsement of a single outcome, but instead assembles the conditions, indicators, and historical precedents that would make a so-called "blue wave" plausible. That measured posture is the story. It signals that sophisticated readers — investors, corporate strategists, policy analysts — are treating electoral probability as a variable to be modelled rather than a verdict to be announced.
What follows is an examination of that analysis and the wider machinery it touches. A wave election is not a single event but a cascade: donor behaviour shifts, polling aggregates tighten or loosen, down-ballot races begin to correlate with the national mood, and prediction markets reprice in real time. Each of these signals carries information for markets long before any ballot is counted. The DealBook lens is instructive precisely because it refuses to separate the political from the financial, treating the two as a single system in which sentiment, money, and institutional incentives move together.
This piece unpacks the mechanics behind wave elections, the indicators analysts actually watch, the sectors most sensitive to legislative turnover, and the ways in which probabilistic thinking outperforms confident prediction. It also considers the limits of the exercise — why a "measured" analysis is often more honest than a bold call, and why the market's reaction to electoral uncertainty frequently matters more than the result itself. Readers seeking a single number will be disappointed; readers seeking a framework will find one.
On This Page
- The Anatomy of a Wave Election and Why Analysts Resist Forecasting One
- The Signals Analysts Actually Monitor Before an Election
- Market Ramifications of Legislative Uncertainty
- The Business Community's Calculus Around Electoral Outcomes
- Reading Polling Aggregates and Prediction Markets Together
- Why Measured Analysis Outlasts Confident Prediction
TL;DR The New York Times analysis of Democrats' chances for a strong election showing is best read as a structured exploration of probability rather than a prediction. It weighs the drivers of a potential wave — fundraising momentum, polling consistency, incumbent vulnerability, and issue salience — against the structural barriers that historically blunt opposition surges. For markets and businesses, the practical takeaway is that electoral uncertainty is priced continuously, and that the direction of legislative control matters less than the timing and durability of policy change. Analysts who model ranges rather than point forecasts consistently outperform those who commit to a single narrative.
The Anatomy of a Wave Election and Why Analysts Resist Forecasting One
A wave election is a rare structural phenomenon in which one party's gains substantially exceed what district-level fundamentals would predict. Analysts typically define it by the scale of seat turnover rather than by any single race, and the threshold is deliberately fuzzy. The 1994, 2006, 2010, and 2018 cycles are the standard reference points in American politics, each producing double-digit net shifts in the House of Representatives. What unites them is not ideology but synchronisation: individual races stop behaving independently and begin moving with the national current, which is precisely the condition that makes forecasting treacherous.
The New York Times analysis, framed through its DealBook business lens, approaches this synchronisation problem with appropriate caution. Rather than asserting that a wave will or will not occur, it examines the conditions under which the probability of one rises. That distinction is not academic hedging; it reflects a genuine methodological divide between punditry, which rewards confident declarations, and quantitative political analysis, which rewards calibrated uncertainty. The latter is far more useful to anyone allocating capital or planning strategy around legislative outcomes.
Why Probability Beats Prediction in Electoral Analysis
Forecasters who assign explicit probabilities to electoral outcomes have consistently outperformed those who issue categorical predictions, and the reason is structural rather than merely statistical. A probability statement can be scored for accuracy across many events, while a prediction is either vindicated or embarrassed. This asymmetry creates perverse incentives: commentators gravitate toward bold claims because bold claims attract attention, even though the expected accuracy of such claims is lower. The measured tone of a serious analysis is therefore a feature, not a weakness, and readers should treat hedging language as evidence of rigour rather than evasion.
There is a deeper point about information aggregation. Electoral probability is distributed across thousands of signals — district-level polling, fundraising filings, candidate quality ratings, historical baselines, and economic indicators — none of which is individually decisive. A well-constructed model weights these signals and produces a distribution; a narrative selects the signals that support a preferred conclusion. The DealBook framing implicitly acknowledges this by treating the question as one of business and market ramifications, where scenario analysis is standard practice and single-point forecasting is regarded as professionally negligent.
The Structural Barriers That Blunt Opposition Surges
Wave elections do not occur in a vacuum, and the institutional terrain matters as much as public sentiment. Gerrymandering compresses the number of genuinely competitive districts, reducing the maximum achievable seat swing regardless of the national vote. Incumbency advantages, donor networks built over multiple cycles, and the tendency of voters to split tickets in specific regions all act as dampeners. Any credible assessment of a potential wave must therefore distinguish between the popular-vote margin and the translation of that margin into legislative seats, a conversion that is neither linear nor stable across cycles.
Timing compounds the difficulty. Waves build over months, and the signals that precede them — candidate recruitment, retirement announcements, primary turnout — are observable but noisy. A surge in small-dollar donations may reflect genuine enthusiasm or a single viral moment; a spate of incumbent retirements may signal anticipated defeat or simple career calculus. The analytical task is to distinguish durable structural shifts from transient noise, and the honest answer is that this distinction often becomes clear only in retrospect. That epistemic limitation is precisely why measured analysis outperforms confident prophecy.
The Signals Analysts Actually Monitor Before an Election
Serious electoral analysis rests on a small set of observable indicators that have demonstrated predictive value across cycles. Generic-ballot polling averages, weighted by sample quality and historical house effects, provide the broadest read on national sentiment. Candidate recruitment quality — whether a party fields experienced officeholders or political newcomers in competitive districts — is a strong leading indicator, because strong candidates self-select into races they believe they can win. Fundraising totals, particularly the ratio of small-dollar to large-dollar contributions, reveal intensity of support in ways that headcount polling cannot capture.
Beyond these, analysts watch incumbent retirement decisions, special-election results as real-time referenda, and the divergence between presidential approval and down-ballot preference. Each signal is imperfect, and the art lies in weighting them appropriately. The DealBook treatment of the question reflects this discipline by refusing to elevate any single indicator to decisive status. Instead, it treats the prospect of a strong Democratic showing as the product of multiple converging conditions, any one of which could fail to materialise.
Polling Aggregation and the Problem of House Effects
Individual polls are noisy instruments, and the discipline of aggregation exists to extract signal from that noise. Different polling firms exhibit systematic biases — so-called house effects — that persist across cycles, and a well-constructed average adjusts for these rather than treating every poll as equally informative. The consequence is that aggregated averages move more slowly than individual polls, which frustrates commentators seeking dramatic shifts but produces more reliable estimates. When an aggregate begins to shift consistently, that movement carries genuine information; when a single poll diverges, it usually does not.
The deeper challenge is that polling measures preference, not turnout. A party may lead comfortably among registered voters while losing among the likely-voter population that actually casts ballots, and the modelling of likely voters is itself a source of significant uncertainty. Analysts who ignore this distinction produce overconfident conclusions. The measured tone of a rigorous analysis reflects awareness that the gap between measured preference and realised outcome is where most forecasting errors originate, and that humility about this gap is a professional virtue rather than an analytical failure.
Fundraising, Small-Dollar Intensity, and Enthusiasm Metrics
Money matters in electoral analysis less as a determinant of outcomes than as a proxy for enthusiasm and organisational capacity. A candidate who raises substantial sums from small donors has demonstrated an ability to mobilise supporters repeatedly, which correlates with turnout. Conversely, a campaign dependent on a handful of large donors may be well funded but poorly mobilised. Analysts therefore examine the composition of fundraising, not merely its total, and treat surges in small-dollar contributions as evidence of genuine grassroots intensity rather than mere financial capacity.
Fundraising data also carries timing information that polling lacks. Contribution patterns respond to news events within days, providing a higher-frequency read on supporter sentiment than monthly polling. When a party's small-dollar intake accelerates across multiple districts simultaneously, that synchronisation is a meaningful signal of nationalised sentiment — precisely the condition that precedes wave elections. The analytical caution remains, however, because fundraising surges can reflect anger as easily as enthusiasm, and anger does not always translate into votes for the party receiving the money.
Market Ramifications of Legislative Uncertainty
DealBook's decision to frame the analysis around business and market ramifications is analytically significant. Markets do not wait for election results; they price probability continuously, and the repricing of assets around shifting electoral odds is observable months before ballots are cast. Sectors with heavy regulatory exposure — healthcare, energy, financial services, and technology — exhibit the most pronounced sensitivity, because legislative control determines the direction of oversight, subsidy, and taxation. The practical question for investors is not who wins but which policy trajectories become more or less likely, and how quickly those expectations are already embedded in prices.
Historical evidence suggests that markets adapt to divided government with remarkable speed, and that the initial reaction to any electoral outcome is frequently reversed within weeks as policy reality replaces campaign rhetoric. The more durable market effects flow from changes in regulatory posture and fiscal direction rather than from the identity of the winning party. Analysts who position portfolios around anticipated election-night reactions often underperform those who focus on the medium-term policy environment, which is slower to change and more predictable in its broad contours.
Sector Sensitivity to Legislative Turnover
Different industries carry markedly different exposure to legislative outcomes, and understanding this differential is essential to interpreting market behaviour around elections. Healthcare companies face direct exposure to drug pricing legislation and insurance regulation; energy firms are sensitive to permitting regimes and subsidy structures; financial institutions respond to capital requirements and consumer protection enforcement. Technology companies face antitrust scrutiny and data regulation that can shift materially with committee control, even when the underlying statutes remain unchanged.
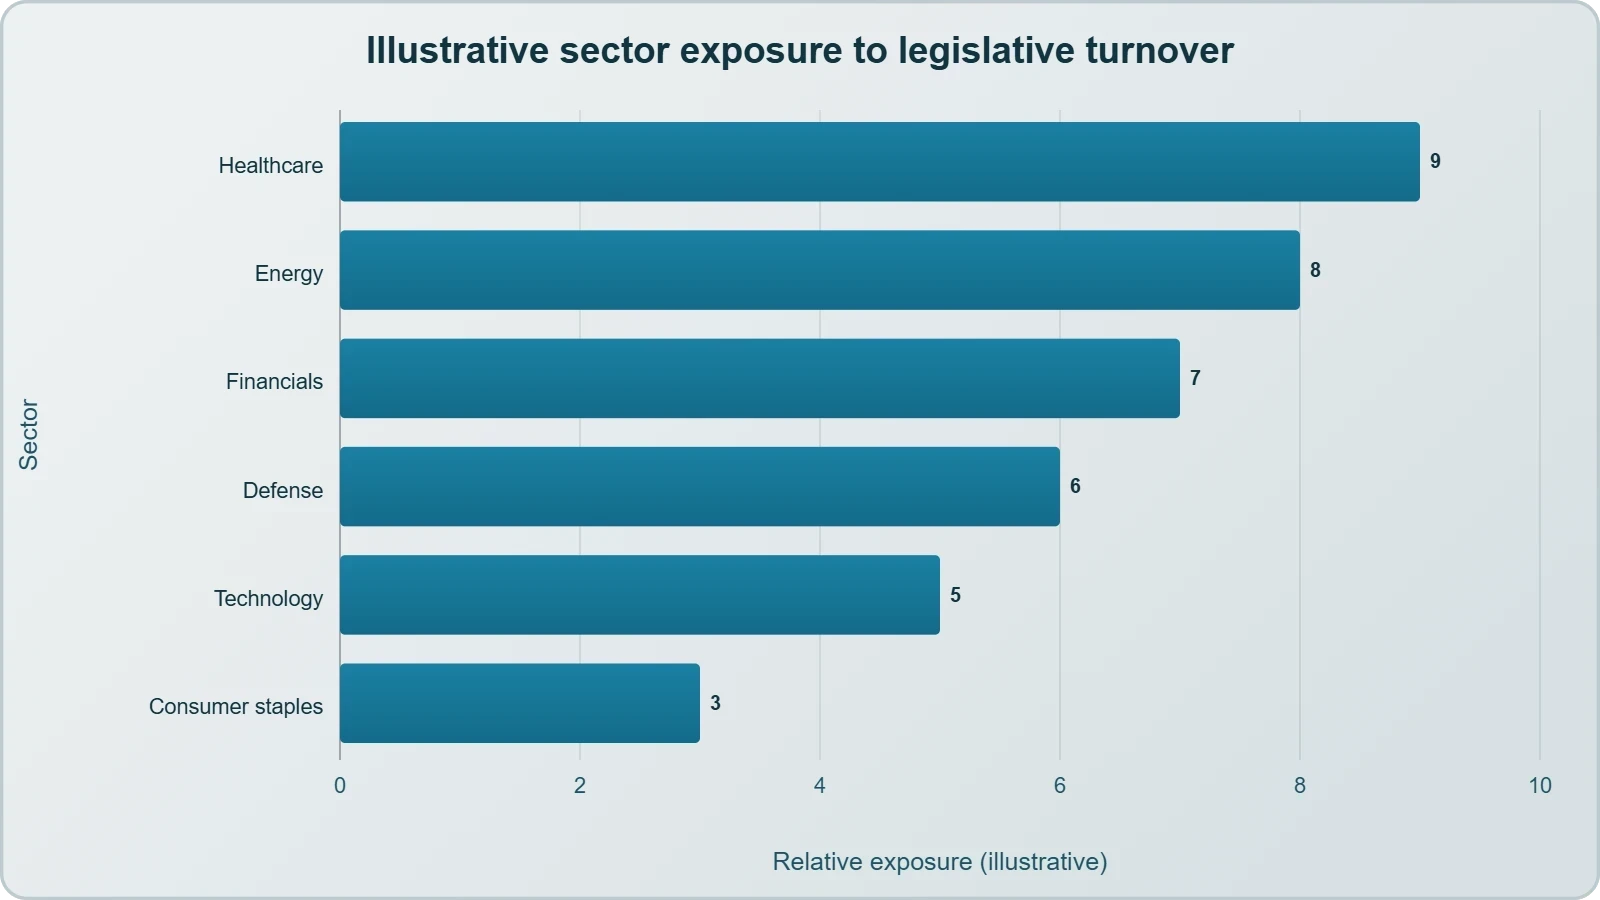
The critical insight is that legislative turnover affects the probability of policy change rather than the certainty of it. A shift in committee control may raise the likelihood of hearings and investigations without producing new legislation, and markets frequently overreact to this distinction. Sophisticated analysts therefore separate the announcement effect — the immediate price movement on election news — from the implementation effect, which unfolds over quarters and depends on the actual legislative agenda that emerges. The former is volatile and often reversed; the latter is where durable investment consequences reside.
Why Markets Price Uncertainty More Than Outcomes
Financial theory has long held that uncertainty itself carries a cost, and electoral cycles provide a natural laboratory for observing this principle. Implied volatility in equity markets frequently rises in the weeks before major elections and falls afterward, regardless of the result, because the resolution of uncertainty is valuable independent of which outcome occurs. This pattern is observable across democracies and suggests that markets are pricing the absence of information rather than favouring any particular political configuration.
The practical implication for business planning is that scenario analysis outperforms directional betting. Firms that model multiple electoral outcomes and their policy consequences make better capital allocation decisions than those that commit to a single forecast. This is precisely the discipline the New York Times analysis embodies: by declining to predict a wave and instead examining the conditions under which one might occur, it provides a framework that remains useful regardless of the eventual result. That is the difference between analysis and prophecy, and it is why measured treatments age better than confident ones.
We Also Published
- 01
- 02
- 03
- 04
The Business Community's Calculus Around Electoral Outcomes
Corporate America's relationship with electoral politics has grown increasingly transactional, and the DealBook framing captures this shift precisely. Business leaders rarely commit publicly to a preferred outcome, preferring instead to prepare for multiple scenarios and to maintain relationships across the political spectrum. This posture is not cynicism but risk management: legislative agendas change, committee chairs rotate, and the firms that navigate transitions most effectively are those that invested in relationships before they needed them. The practical consequence is that corporate behaviour around elections reveals more about anticipated policy risk than about ideological preference.
Trade associations and industry groups typically hedge their political spending across both parties, allocating resources to incumbents and to candidates in competitive races regardless of affiliation. This strategy reflects a straightforward calculation: access matters more than alignment, and the marginal value of a relationship with a likely winner exceeds the value of ideological consistency. When analysts observe a shift in the direction of corporate giving, it usually signals a reassessment of electoral probability rather than a change in political philosophy, and should be interpreted accordingly.
Regulatory Expectation and Capital Allocation
Capital allocation decisions are forward-looking by nature, and firms incorporate expected regulatory environments into their planning horizons years in advance. A shift in legislative control that raises the probability of stricter environmental enforcement, for instance, may accelerate or delay investment in certain asset classes long before any statute is enacted. This anticipatory behaviour means that electoral outcomes influence real economic activity through the channel of expectation, not merely through legislation that eventually passes. The magnitude of this effect is difficult to measure but consistently observable in sector-level investment patterns.
The asymmetry of regulatory risk deserves particular attention. New obligations are typically easier to impose than existing ones are to remove, which means that regulatory accumulation has a ratchet-like quality regardless of which party holds power. Firms therefore plan for the direction of regulatory travel rather than for discrete reversals, and the electoral question becomes one of pace rather than direction. This insight tempers the dramatic narratives that surround wave elections and explains why markets often respond to electoral outcomes with less volatility than commentators anticipate.
Scenario Planning as the Professional Standard
The professional consensus among strategists is that scenario planning outperforms prediction, and electoral analysis is no exception. A well-constructed scenario framework identifies the key variables — legislative control, committee composition, fiscal trajectory — and models outcomes across their combinations. This approach does not require forecasting which scenario will obtain; it requires only that the firm be prepared for each. The discipline is unglamorous but robust, and it explains why sophisticated organisations rarely make public bets on electoral outcomes while quietly preparing for all of them.
The New York Times analysis fits this professional mould. By examining the conditions under which a strong Democratic showing might occur rather than asserting that it will, it provides readers with the raw material for scenario construction. That is a more valuable contribution than a confident prediction, because it remains useful across the full range of outcomes. The measure of good analysis is not whether it turns out to be right, but whether it improves the quality of decisions made under uncertainty — and by that standard, measured treatments consistently outperform bold ones.
Reading Polling Aggregates and Prediction Markets Together
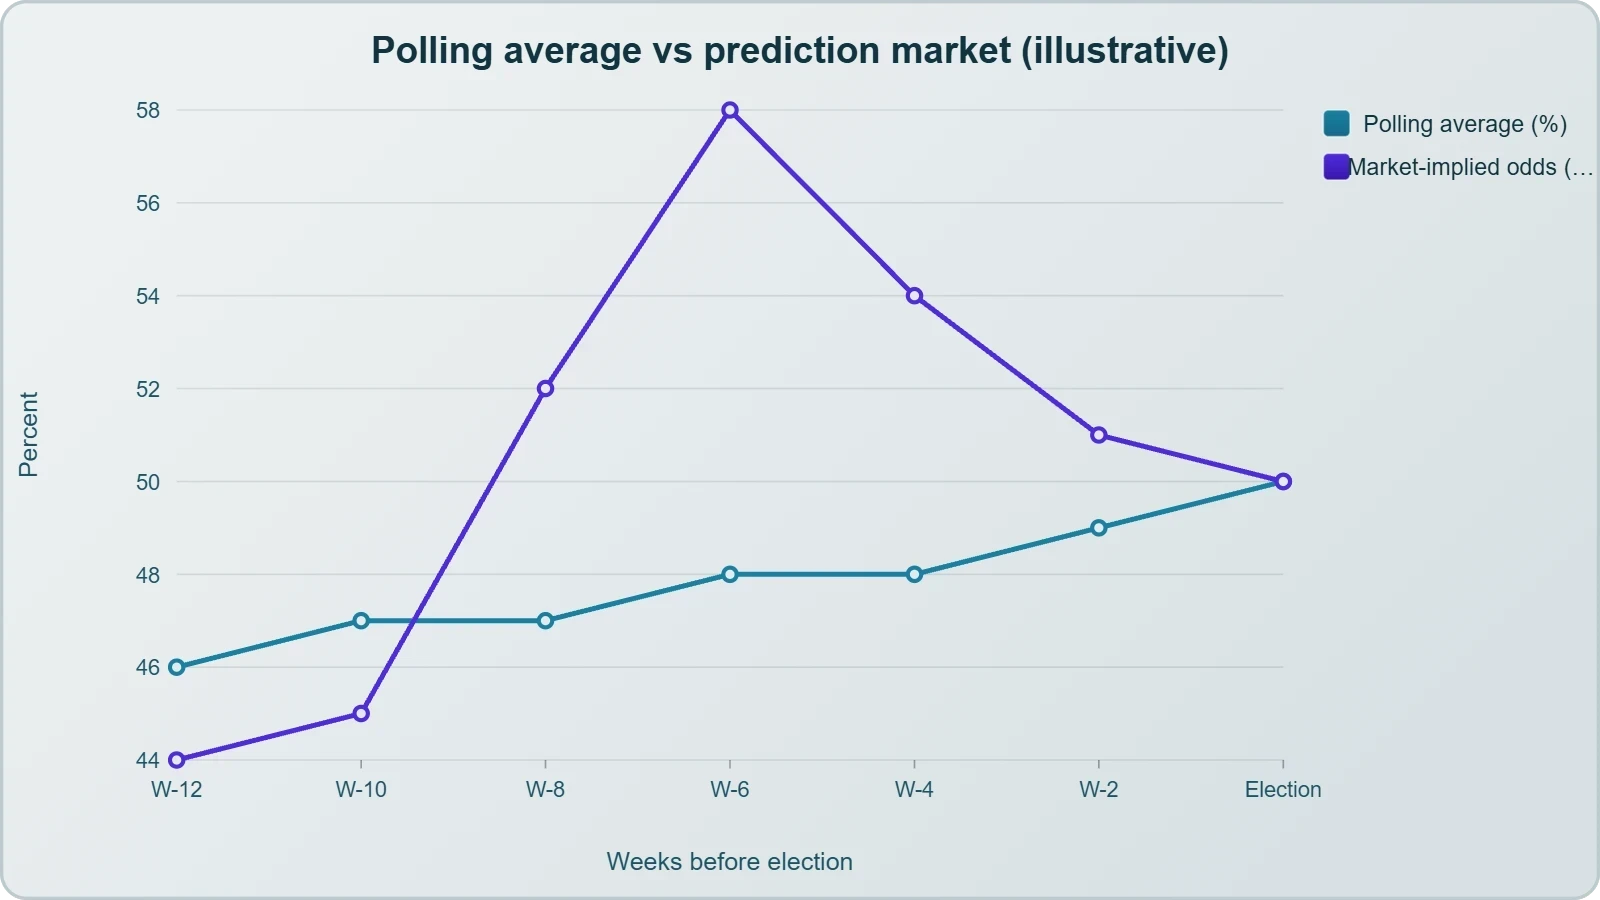
Two distinct information markets now run in parallel: traditional polling aggregates and prediction markets where participants trade contracts on electoral outcomes. Each has strengths the other lacks. Polling aggregates capture stated preference across representative samples but are slow to update and vulnerable to systematic non-response bias. Prediction markets aggregate dispersed information rapidly and carry financial consequences for error, which sharpens accuracy, but they can be thin, manipulable, and prone to overreaction on limited volume. Reading them together produces a more reliable picture than relying on either alone.
The divergence between the two is often more informative than their agreement. When prediction markets price an outcome more confidently than polling aggregates support, the gap typically reflects either superior private information or speculative excess, and distinguishing between these requires examining trading volume and participant composition. Professional analysts treat prediction market prices as one input among many rather than as an oracle, and they remain alert to the possibility that thin markets can produce prices that reflect the views of a small number of participants rather than the broader information environment.
The Limits of Quantitative Electoral Models
Quantitative models have improved substantially, but their limitations are structural and worth stating plainly. Models trained on historical data struggle when the political environment departs from historical precedent, and the number of wave elections in the modern record is small enough that statistical confidence about their causes remains limited. The consequence is that model outputs should be treated as informed priors rather than precise estimates, and that the uncertainty bands around any forecast are wide enough to encompass multiple plausible outcomes.
There is also the problem of feedback loops. Published forecasts influence donor behaviour, media coverage, and voter turnout, which means that the act of forecasting can alter the phenomenon being forecast. This reflexivity is well documented in financial markets and applies with equal force to electoral analysis. The professional response is humility: acknowledge the limits of the model, present ranges rather than point estimates, and update continuously as new information arrives. The measured tone of serious analysis is not a rhetorical flourish but a direct consequence of these epistemic constraints.
What a Strong Showing Would Actually Change
Should Democrats achieve a strong nationwide showing, the practical consequences would unfold through specific institutional channels rather than through a single dramatic rupture. Committee chairmanships would change hands, altering the agenda-setting power that determines which legislation receives hearings and which investigations proceed. Agency oversight would intensify or relax depending on the new majority's priorities, and the confirmation pipeline for judicial and executive appointments would shift accordingly. These are the mechanisms through which electoral outcomes become policy outcomes, and they operate gradually rather than instantaneously.
The more subtle consequence would be a change in the expectations that businesses, investors, and foreign governments hold about the direction of American policy. Expectations are powerful because they shape behaviour before any legislation passes, and a credible signal of legislative change can move capital and alter negotiating positions well in advance of statutory action. This is why the DealBook framing is apt: the business ramifications of a wave election begin to materialise the moment the probability of one rises, not on the day the results are certified.
Why Measured Analysis Outlasts Confident Prediction
The most durable lesson from the New York Times treatment is methodological rather than political. Analyses that decline to forecast and instead map the conditions under which outcomes become likely retain their value across the full range of results, while confident predictions are discarded the moment they are wrong. This asymmetry explains why serious publications favour measured language even when readers crave certainty: the goal is to inform decisions under uncertainty, not to satisfy the appetite for drama. The distinction between analysis and prophecy is the distinction between a tool and a bet.
For readers navigating electoral information, the practical implication is to privilege frameworks over conclusions. A framework that identifies the relevant variables, explains their interactions, and specifies what evidence would change the assessment is more useful than any single forecast, because it can be applied repeatedly as conditions evolve. The DealBook analysis provides such a framework implicitly, and readers who extract it will be better positioned than those who simply wait for a verdict. That is the enduring value of measured treatment in an environment saturated with confident noise.
Distinguishing Signal from Narrative in Electoral Coverage
Electoral coverage is unusually vulnerable to narrative contamination because the stakes are high and the audience is emotionally invested. Stories that fit a preferred narrative spread faster than those that complicate it, and the resulting information environment rewards confidence over calibration. Readers seeking accuracy must therefore apply deliberate filters: does the analysis specify its assumptions, acknowledge contrary evidence, and present ranges rather than points? These questions separate rigorous work from advocacy dressed as analysis, and they apply equally to coverage from any outlet.
The discipline of reading for structure rather than conclusion is learnable and valuable. An analysis that says "a strong showing is possible if these conditions hold" provides more actionable information than one that says "a strong showing is likely," because the former identifies the variables to monitor. The latter offers only a conclusion to accept or reject. In an environment where conditions change continuously, the framework outlives the forecast, and the reader who extracts the framework gains an enduring analytical asset rather than a perishable opinion.
Applying the Framework Beyond a Single Cycle
The analytical approach examined here generalises well beyond any particular election. The same logic — identify the drivers, weight the signals, model the scenarios, and update continuously — applies to regulatory decisions, judicial appointments, and international negotiations. In each case, the professional standard is to prepare for a range of outcomes rather than to bet on one, and in each case the temptation to offer confident prediction is strong because audiences reward it. The discipline lies in resisting that temptation and in valuing calibration over certainty.
For businesses, investors, and engaged citizens alike, the practical takeaway is that electoral uncertainty is a condition to be managed rather than a puzzle to be solved. The tools for managing it are well established: scenario planning, continuous monitoring of leading indicators, and a willingness to revise assessments as evidence accumulates. The New York Times analysis, by declining to forecast and instead illuminating the conditions that matter, models this discipline. Its value lies not in the answer it provides but in the quality of the questions it teaches readers to ask.
From our network :
- The Final Descent: How ESA Retired the Legendary Cluster Constellation After 24 Years of Space Weather ScienceAfter 24 years mapping Earth’s magnetosphere, ESA’s Cluster mission concluded with a precisely controlled reentry over the South Pacific. This analysis explores the scientific legacy, engineering decisions, and debris mitigation principles behind one of space exploration’s most responsible retirements.
- Committed Mediterranean Precipitation Decline: Why Emissions Cuts Alone Cannot Restore Winter RainsNew NOAA research reveals that Mediterranean winter rains may decline irreversibly even with emissions cuts. Explore the science of committed climate change and regional impacts.
- How AI Agents Will Change the Way We Manage Personal FinancesExplore how AI agents are transforming personal finance through automated budgeting, bill payment, and investment management, while examining the critical security protocols and governance frameworks required for safe deployment.
- University Language Proficiency Exams: Why Institutional Tests Demand Different Preparation Than IELTS and TOEFLDiscover why university-specific language proficiency examinations differ fundamentally from IELTS and TOEFL, and learn strategic preparation approaches for institutional assessment success.
- CISA’s Ten-Advisory Wave: Why Generic Patching Fails in OT and How to Build Product-Specific PlaybooksCISA released ten ICS advisories in one week, exposing critical infrastructure risks. Generic patching fails in OT. Learn to build product-specific remediation playbooks.
- The Hidden Cost of AI Convenience: Why Over-Permissioned Agents Are a Security Time BombDiscover why AI agents with excessive permissions create dangerous single points of failure, and learn how implementing least privilege principles can protect your organization from exploitation.
- Forbidden Matrix Patterns and Visible Lattice Points: A Geometric DictionaryExplore how multidimensional 0–1 matrices encode geometric truths, linking forbidden patterns to visible lattice points and hypergraph theory, with applications in combinatorics and computational geometry.
- Live Online English Classes for Kids: Do They Actually Reduce Anxiety?A ten-week study reveals that synchronous online English classes can significantly reduce child language anxiety while improving listening and reading skills. Discover what makes these programs effective and how parents can select the right one.
- Mobile Learning and VR in English: What Global Evidence Reveals About Effective Language TechnologyA systematic review across 14 countries reveals which language-learning technologies genuinely work. Mobile learning, AI, and VR show measurable benefits when pedagogically integrated. This evidence-based guide helps educators and learners select technology that delivers real return on investment.
RESOURCES
- Resources will be updated soon.
- 01
- 02
- 03
- 04
- 05
- 06
- 07
- 08
0 Comments