
When a small business owner approaches a lender hoping for a conventional loan, the expectation is straightforward: a defined principal, a fixed repayment schedule, and an interest rate disclosed in plain terms. What an NPR investigation documented instead was a merchant cash advance that converted a routine financing need into a seven-year cycle of escalating obligations. The distinction matters enormously, because a merchant cash advance is not technically a loan at all, and that legal nuance is precisely what allows the product to operate outside many of the consumer and small-business protections that govern traditional credit.
The story sits at the intersection of financial innovation and regulatory drift. Merchant cash advances emerged as a fast, friction-light alternative for businesses that banks had grown reluctant to serve after the 2008 credit contraction. Over time, however, the product migrated from a niche bridge-financing tool into a sprawling industry whose economics often depend on repeat renewals rather than on the borrower's success. The seven-year struggle described in the report is not an isolated misfortune but a structural feature of how these agreements are priced, renewed, and enforced.
Understanding this case requires looking past the headline and into the mechanics: how advances are underwritten, how repayment is collected through daily or weekly holds on receivables, how effective annualized costs can climb far beyond advertised factor rates, and why the absence of a stated interest rate leaves borrowers without a clear yardstick. The analysis below examines the industry's architecture, the legal gray zone it occupies, the human and commercial costs of prolonged debt, and the reforms that regulators and advocates are beginning to demand.
On This Page
TL;DR A small business owner who requested a loan received a merchant cash advance instead, triggering a seven-year debt spiral documented by NPR. Merchant cash advances are structured as purchases of future receivables rather than loans, which lets providers sidestep usury caps and standard disclosure rules. Repayment through automated holds on daily receipts, combined with factor rates that obscure true annualized cost, can push effective borrowing costs well into triple digits. Renewals that pay off one advance with another deepen the trap. The case illustrates a broader regulatory gap in small-business finance and strengthens the case for clearer cost disclosure, licensing, and responsible-underwriting standards.
The Anatomy of a Merchant Cash Advance
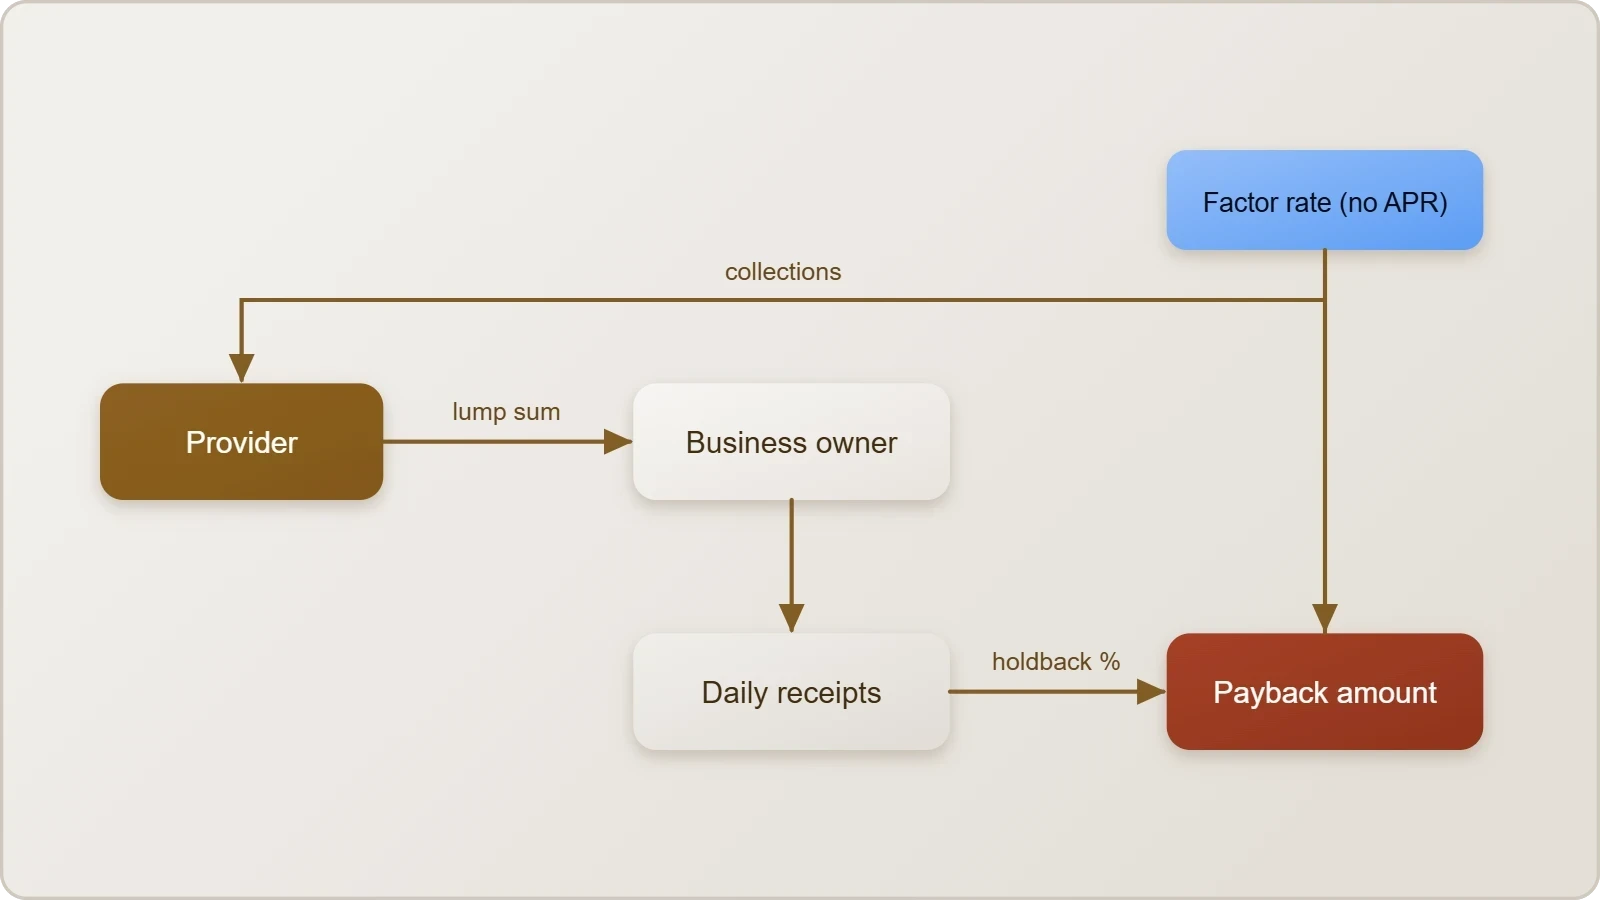
A merchant cash advance is best understood as a forward purchase of future card or bank receipts rather than a loan. The provider pays a business a lump sum today and then collects a fixed percentage of daily sales until a predetermined total, known as the payback amount, has been remitted. Because the transaction is framed as a sale of receivables, it falls outside the legal definition of lending in many jurisdictions, which means interest-rate caps, truth-in-lending disclosures, and certain licensing requirements frequently do not apply. That structural choice is the source of both the product's speed and its opacity.
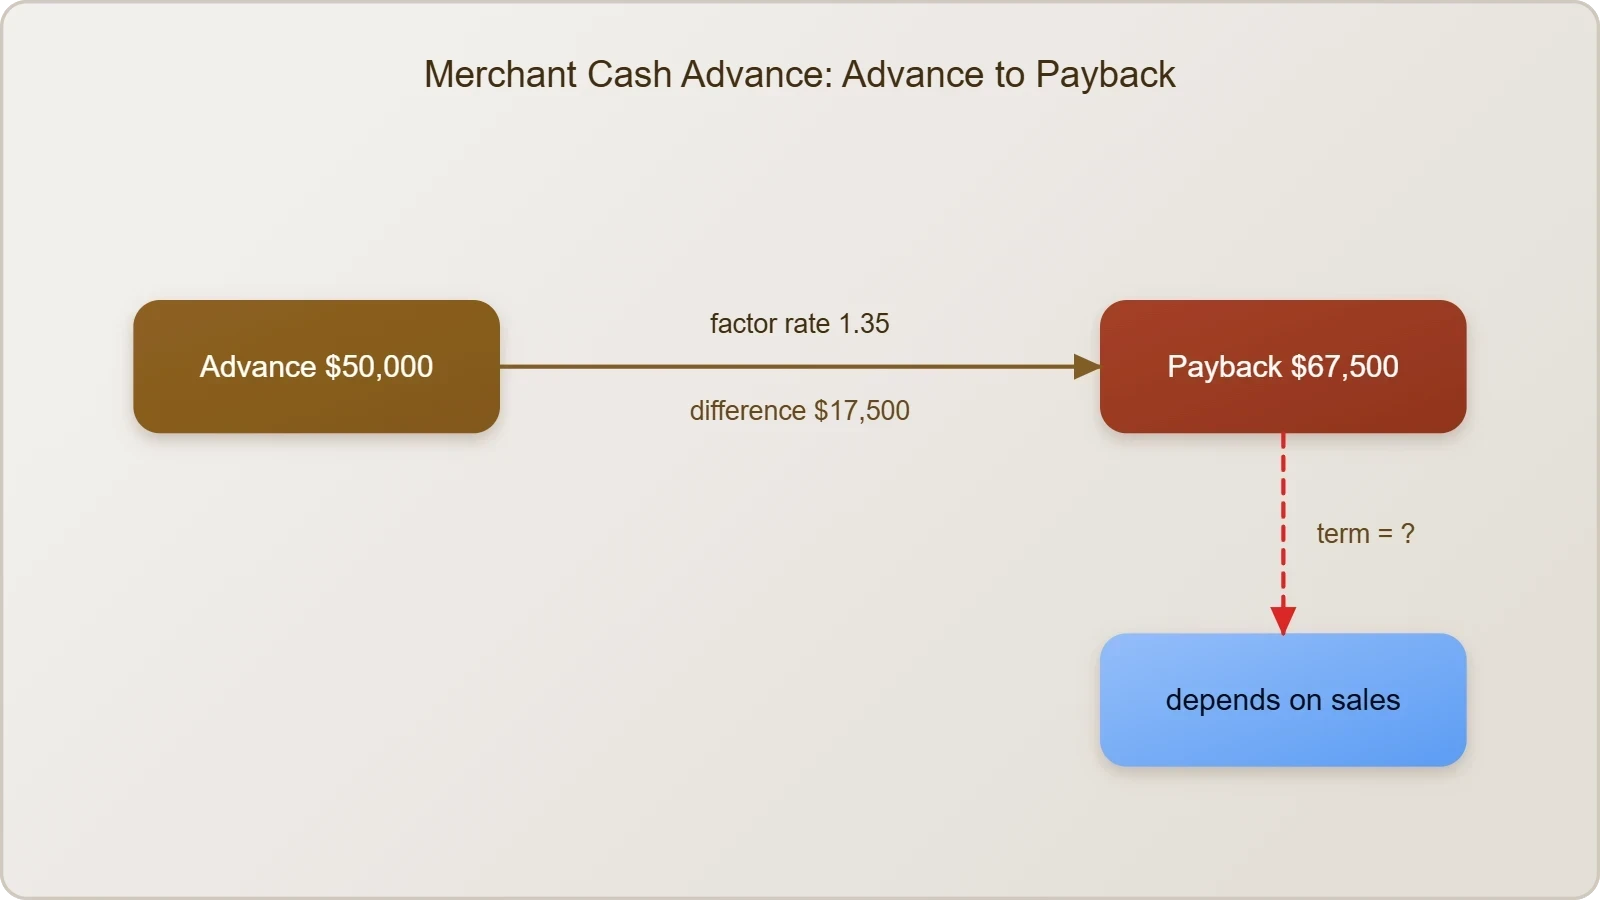
The pricing convention reinforces the confusion. Providers typically quote a factor rate, such as 1.3 or 1.4, rather than an annual percentage rate. A factor rate of 1.35 on a $50,000 advance means the business repays $67,500, and the $17,500 difference is presented as a one-time cost rather than interest accruing over time. Because repayment accelerates when sales are strong and slows when they weaken, the implied annualized cost depends entirely on how quickly the balance clears, making direct comparison with a bank loan genuinely difficult for a busy owner.
How the Money Actually Moves
Funding is typically fast, often within days, and underwriting relies heavily on observed revenue patterns rather than on formal financial statements. Providers examine card-processing volume, bank-deposit history, and average daily balances, then set the remittance percentage so that collections remain tolerable relative to cash flow. The appeal to an owner facing a payroll crunch or an equipment emergency is obvious: minimal paperwork, rapid disbursement, and repayment that flexes with sales. The catch is that the flexibility is asymmetric, since the total owed does not shrink when business slows, only the pace of collection does.
Collection itself is usually automated. The provider places a hold on a fixed percentage of daily card settlements or initiates recurring debits from the business account, a mechanism known as a holdback or split withholding. Because the deduction happens before the owner sees the cash, the obligation can feel invisible until liquidity tightens. When sales dip, the same percentage takes a larger share of a smaller pie, squeezing the working capital the business needs to recover. That dynamic is central to how a short-term fix can metastasize into a multi-year burden.
Why Owners Choose It Anyway
Speed and access explain most of the demand. Traditional small-business lending involves documentation, credit review, and timelines measured in weeks, and many applicants are declined outright. Businesses with thin credit files, seasonal revenue, or recent losses often find banks unreceptive. A merchant cash advance promises capital in days with minimal paperwork, and for an owner staring at an imminent payroll or a supplier deadline, that immediacy can outweigh every caution. The product fills a genuine gap, which is why blanket condemnation misses the point and why the policy conversation must address both access and protection.
Marketing also plays a role. Providers frequently present advances as partnerships or revenue-based financing, language that sounds collaborative rather than debt-like. Owners may not fully grasp that the payback amount is fixed regardless of performance, or that the holdback percentage applies to gross receipts rather than profit. When the true cost is expressed as a single factor rate, the psychological distance between a 1.35 multiplier and a triple-digit annualized rate is enormous. That gap in comprehension is not incidental; it is a predictable consequence of how the product is described.
We Also Published
The Seven-Year Debt Spiral
The NPR account describes a borrower who spent seven years extricating themselves from an obligation that began as a modest financing request. That duration is the most telling detail in the story, because merchant cash advances are nominally short-term instruments, typically structured to clear within months. When an advance stretches across years, it usually signals a renewal cycle in which a new advance is used to satisfy the remaining balance of the previous one, with fees layered on at each turn. The debt does not grow because the business is failing; it grows because the refinancing itself is the business model.
Each renewal resets the clock and adds a fresh factor-rate premium, so the cumulative cost compounds even if the underlying principal barely moves. Owners describe a treadmill sensation: the daily holdback consumes the cash that would otherwise fund growth, revenue stagnates, and the only available liquidity comes from another advance. The seven-year timeline in the report is therefore less an anomaly than an arithmetic outcome of repeated renewals under fixed payback amounts. Once the cycle begins, exiting it requires either a windfall or a formal restructuring.
The Renewal Trap in Sequence
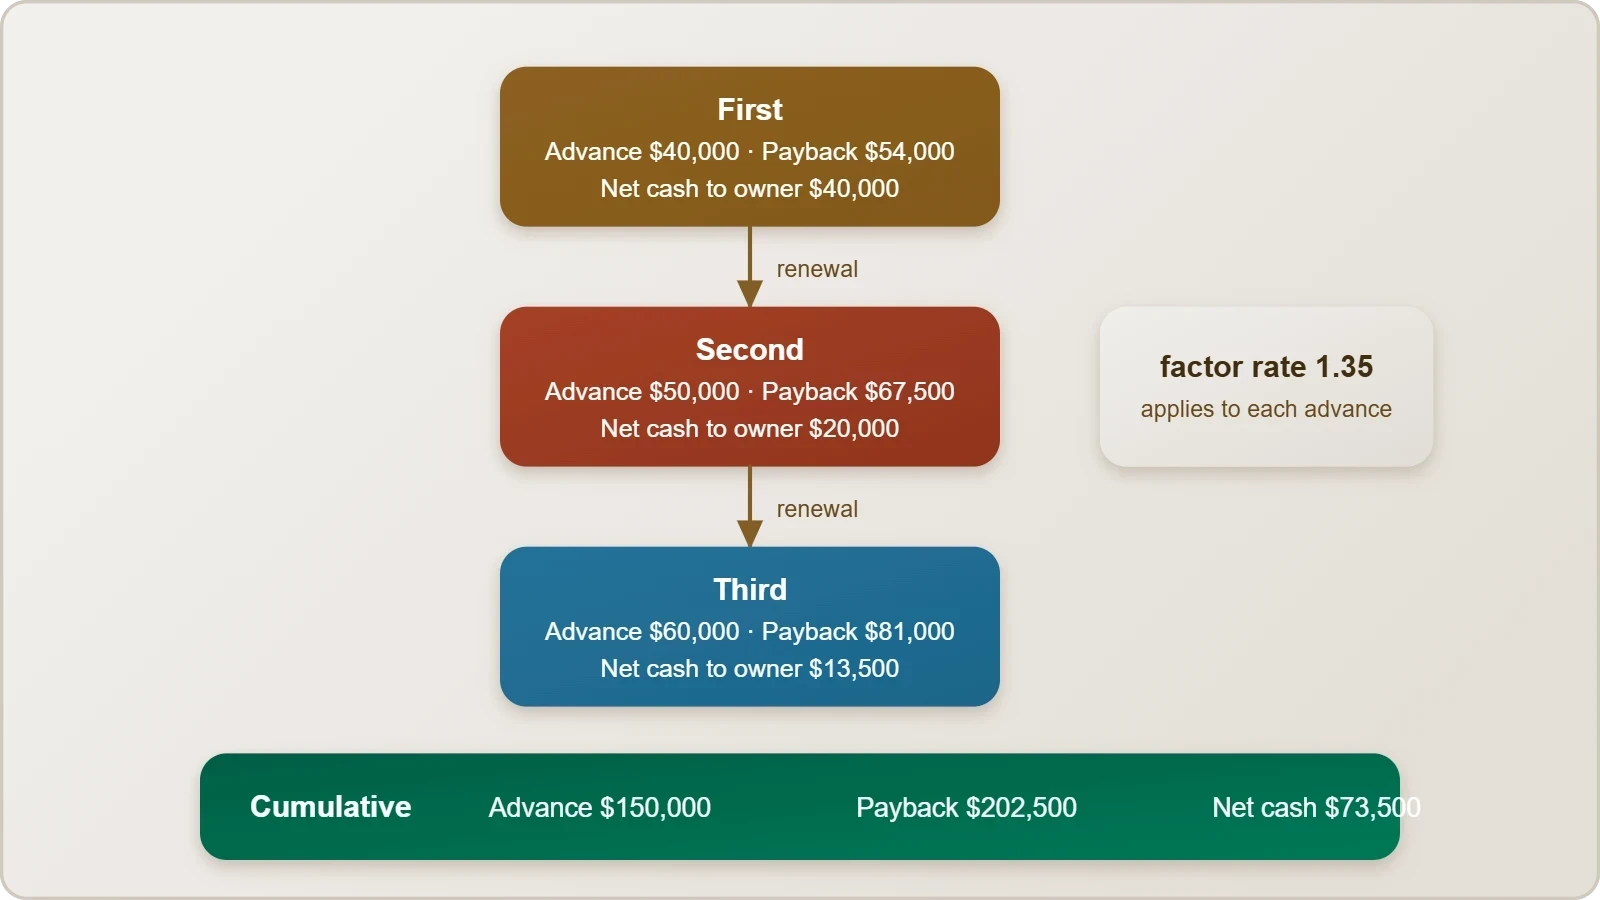
Consider a stylized illustration. A business takes a $40,000 advance at a 1.35 factor rate, owing $54,000. Sales soften, the holdback slows collections, and the owner needs working capital. A second provider offers $50,000, of which $30,000 retires the first balance and $20,000 arrives as cash, but the new payback is $67,500. The nominal principal has risen while net proceeds have shrunk. Repeat this pattern and the effective cost compounds dramatically, even though no single transaction looks catastrophic in isolation.
The True Cost Hidden Behind Factor Rates
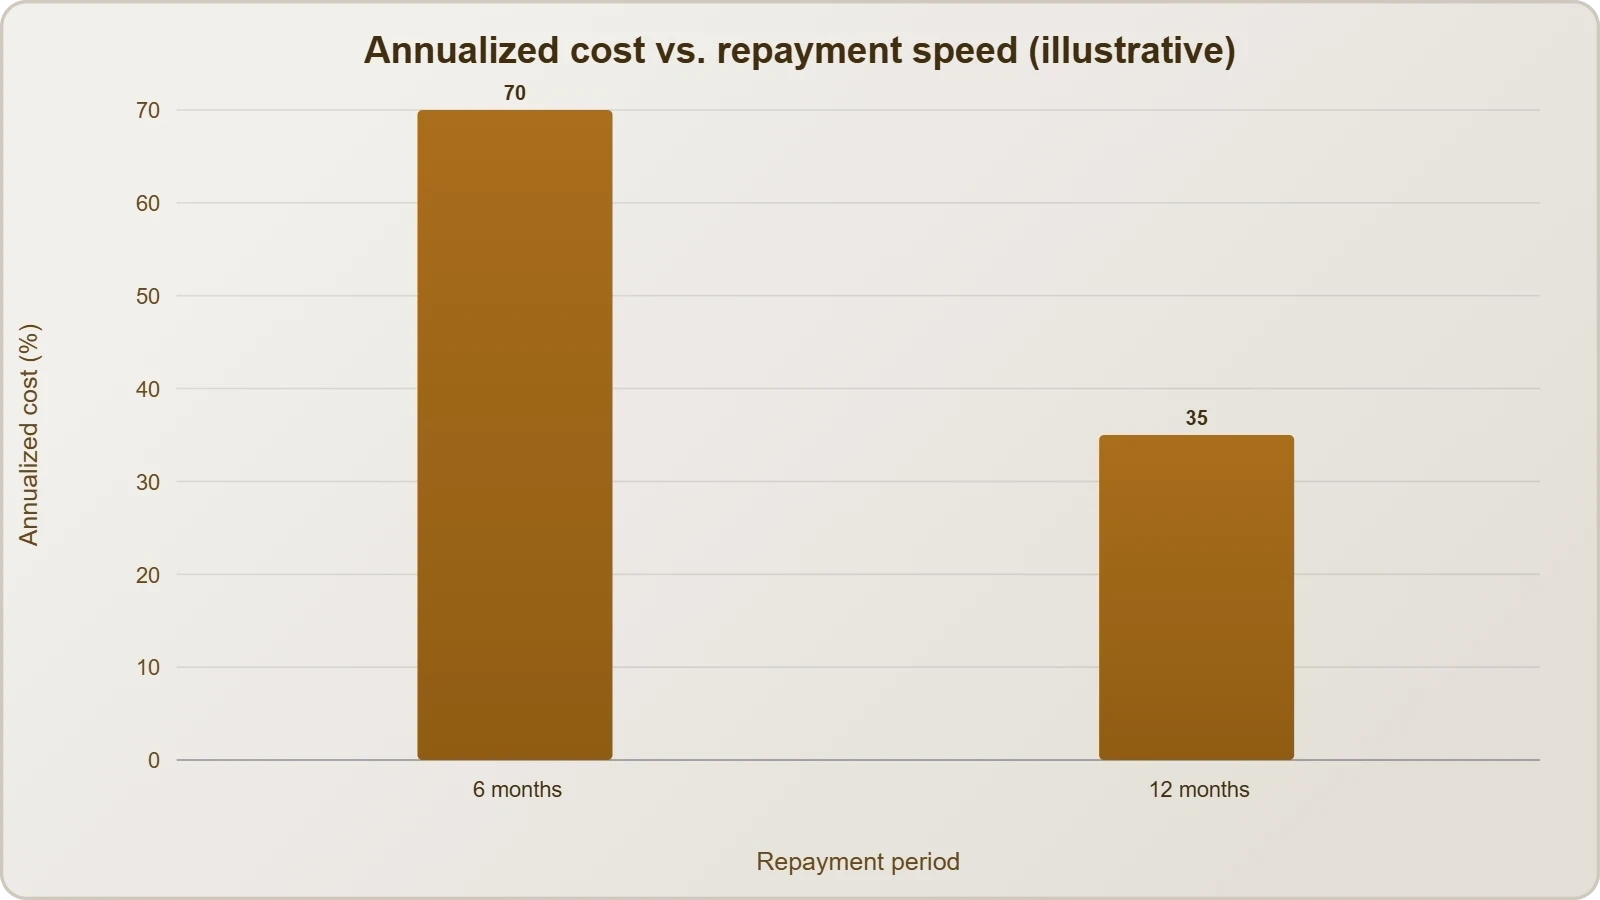
Converting a factor rate into an annualized percentage requires knowing the repayment period, and that is precisely the variable the product leaves open. If a $50,000 advance at a 1.35 factor rate clears in six months, the implied annualized cost is roughly 70 percent. If it takes twelve months, the figure falls, but if renewals extend the effective term while adding new fees, the blended cost can exceed 100 percent. The formula is straightforward once the term is known, yet the term itself depends on sales volume, which means the borrower cannot know the real price at signing.
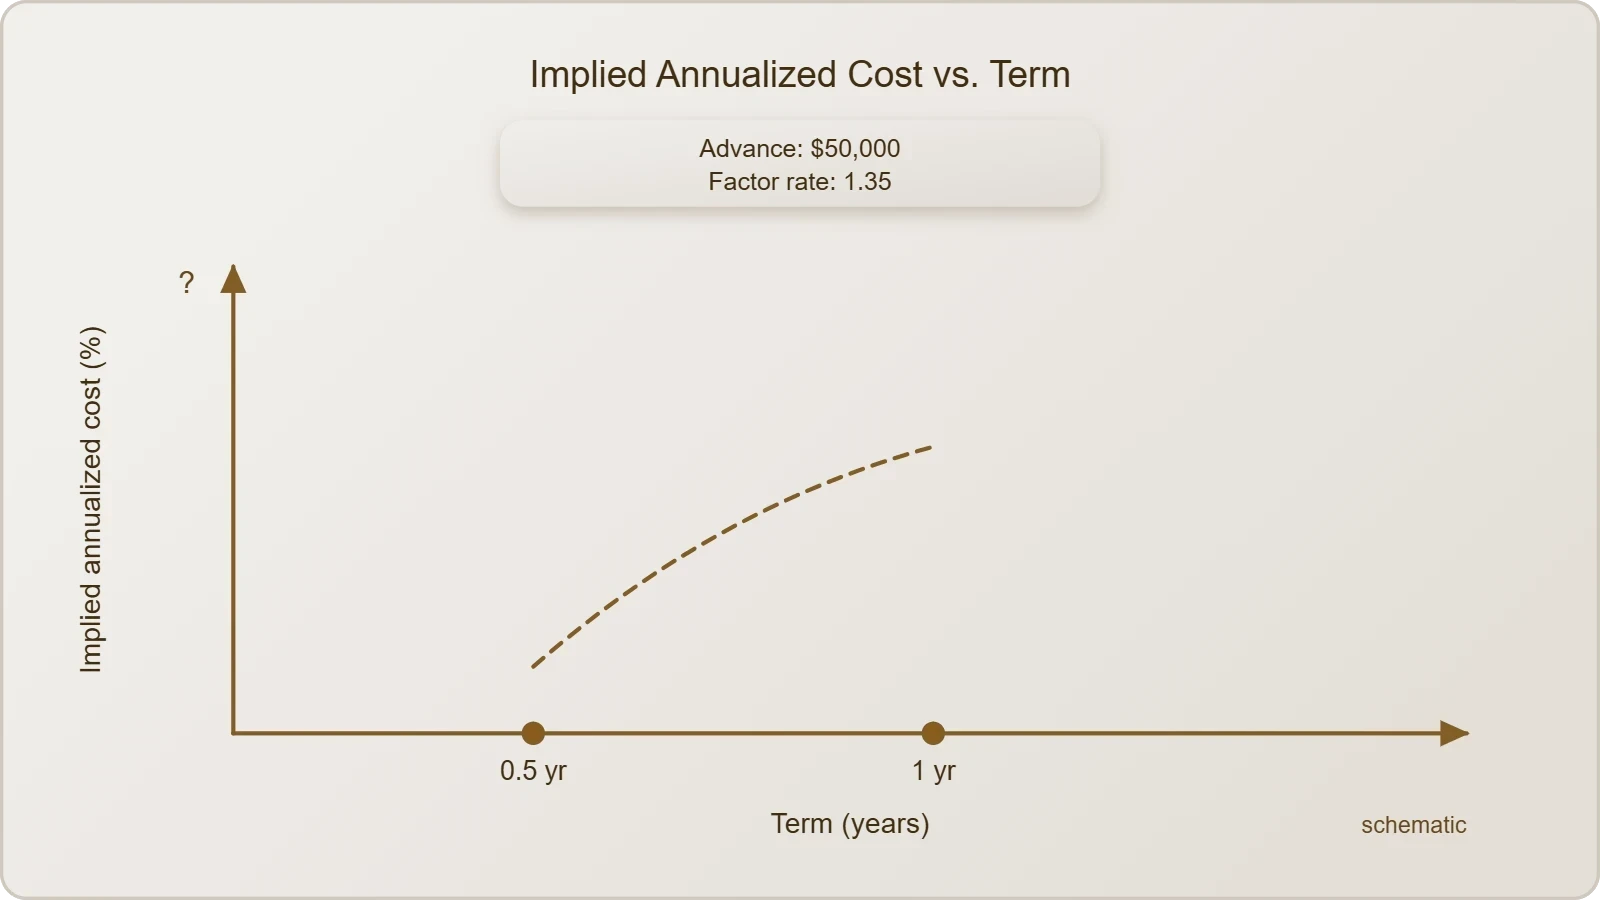
This opacity is not a minor disclosure quibble. It prevents owners from comparing an advance against a bank line of credit, a community development loan, or even a credit card, all of which quote annualized rates. Without a common metric, the market cannot discipline pricing through competition, and borrowers cannot make informed choices. Several states have begun requiring disclosure of an annualized rate for small-business financing, and early evidence suggests that transparent pricing reduces both demand for the most expensive products and the incidence of renewal spirals.
Regulatory Patchwork and Legal Gray Zones
Oversight of merchant cash advances varies sharply by jurisdiction. Some states treat certain arrangements as loans regardless of labeling, applying usury caps and licensing rules; others defer to the contract's characterization. Federal consumer protections largely do not extend to commercial borrowers, leaving small-business owners outside the disclosure regime that governs mortgages and consumer credit. The result is a patchwork in which identical transactions carry different legal consequences depending on where the business operates, and in which providers can structure around the strictest regimes.
Enforcement has begun to tighten. Attorneys general in several states have pursued providers for deceptive marketing and for arrangements courts deemed disguised lending. The Federal Trade Commission has signaled interest in unfair or deceptive practices in small-business finance, and state legislatures have introduced disclosure bills modeled on consumer credit statutes. Industry groups counter that heavy-handed regulation would shrink credit access for the very businesses the rules aim to protect, a tension that animates nearly every debate in this space.
- 01
- 02
- 03
- 04
Human and Commercial Consequences
Behind the arithmetic sits a business owner making decisions under pressure. The NPR report's seven-year arc implies sustained stress: depleted reserves, deferred investment, strained relationships with suppliers, and the constant management of daily holds on receipts. Owners in this position often describe shame and isolation, reluctant to disclose the arrangement to partners or family. The commercial damage compounds the personal toll, because a business that cannot retain working capital cannot hire, expand, or weather a slow quarter, and the resulting stagnation makes the debt harder to escape.
Employees and suppliers absorb secondary effects. When cash flow is committed to daily remittances, payroll timing becomes precarious and payment terms with vendors stretch. Some businesses reduce hours or delay maintenance, eroding the operational base that generates the very revenue the advance depends upon. The seven-year timeline in the report suggests a business that survived but did not thrive, diverting years of potential growth into servicing an obligation that was originally meant to be a bridge. That opportunity cost rarely appears in industry statistics.
What Borrowers Can Do Differently
Practical defenses begin with translation. Any owner considering an advance should convert the factor rate into an annualized figure using the expected repayment period, and should model the holdback against a pessimistic sales scenario rather than an average one. Reading the contract for confession-of-judgment clauses, personal guarantees, and provisions governing reconciliation is essential, because these terms determine what happens when sales disappoint. Comparing against alternatives, including community development financial institutions, credit unions, and revenue-based lenders with transparent pricing, provides a genuine benchmark.
Negotiation is also possible. Some providers will adjust holdback percentages, cap total payback, or offer a true-up mechanism when actual receipts fall short of projections. Owners who document their cash flow and communicate early often secure better terms than those who wait for default. Where a spiral has already begun, nonprofit small-business advisers and legal aid organizations can help negotiate settlements or restructure obligations, and bankruptcy protection remains an option that should be evaluated with counsel rather than treated as a last resort shrouded in stigma.
Toward a Fairer Small-Business Credit Market
The policy response that emerges from cases like the one NPR documented is not prohibition but transparency. Requiring providers to disclose an annualized cost, standardizing the language used in marketing, and mandating clear explanations of holdback mechanics would let owners compare products on equal footing. Licensing regimes with capital and conduct requirements could raise standards without eliminating access. Several states have already moved in this direction, and the early results suggest that disclosure alone shifts behavior, pushing providers toward more competitive pricing and reducing the most predatory renewal practices.
Supply-side solutions matter equally. Community development financial institutions, credit unions, and mission-driven lenders offer alternatives, but their reach is limited by capital and operational capacity. Expanding small-business lending through public guarantees, credit-scoring reforms that recognize alternative data, and technical assistance programs could reduce the population of owners who turn to advances out of desperation. The goal is a market where speed and access coexist with honesty about cost, so that a business seeking a loan receives something it can actually repay.
Lessons for Owners and Lenders Alike
For owners, the central lesson is that the label on a financial product matters less than its arithmetic. A seven-year struggle can begin with a single signature on a document that never uses the word interest. For lenders and policymakers, the lesson is that legal form should not determine whether basic fairness applies. When a transaction functions economically like credit, it deserves the disclosure and protections that credit attracts. Closing that gap is the practical work ahead, and the NPR account provides a concrete, human illustration of why it cannot wait.
The broader financial system also has a stake. Small businesses employ a substantial share of the workforce, and their resilience depends on access to credit that supports growth rather than consuming it. A market that profits from distress ultimately undermines the productive base it serves. Aligning incentives so that providers succeed when borrowers thrive, rather than when they renew, is both an ethical imperative and a sound economic strategy. The seven-year case is a warning worth heeding before the next owner signs.
Reading the Case in a Wider Financial Context
The NPR report arrives at a moment when small-business credit is being reshaped by technology and by the retreat of traditional banks from smaller commercial loans. Fintech platforms can underwrite in minutes using transaction data, and the convenience they offer is genuine. Yet convenience without transparency can become a mechanism for extracting value from businesses least able to bear it. The seven-year case is a reminder that innovation in credit must be matched by innovation in disclosure, or the efficiency gains accrue disproportionately to providers rather than to the enterprises they serve.
There is also a macroeconomic dimension. Small businesses are sensitive to interest-rate cycles, and when conventional credit tightens, demand for alternative products rises. That countercyclical pattern means the most vulnerable borrowers are pushed toward the most expensive options precisely when the economy is weakest. Understanding this dynamic helps explain why the industry has grown despite persistent criticism, and why regulatory attention tends to intensify after downturns. The case documented by NPR is likely to be cited in future debates over how to balance access with protection.
What the Numbers Suggest About Scale
Industry estimates place annual merchant cash advance origination in the tens of billions of dollars, spread across thousands of providers ranging from established fintech firms to small brokers. Because the market is fragmented and lightly regulated, precise figures are elusive, but surveys of small businesses consistently show that a meaningful minority have used alternative financing and that a portion report difficulty exiting repeated advances. The seven-year case is statistically unusual in its duration but structurally ordinary in its mechanics, which is what makes it instructive rather than merely unfortunate.
Cost data reinforce the concern. Studies of alternative small-business finance have found effective annualized rates frequently exceeding 50 percent and sometimes surpassing 100 percent once renewals and fees are included. For a business operating on thin margins, such costs can consume the majority of incremental revenue, leaving little for reinvestment. When those costs are not disclosed as rates, owners cannot factor them into pricing decisions, and the resulting misallocation of capital affects not just individual firms but the competitive landscape in which they operate.
From our network :
- The Final Descent: How ESA Retired the Legendary Cluster Constellation After 24 Years of Space Weather ScienceAfter 24 years mapping Earth’s magnetosphere, ESA’s Cluster mission concluded with a precisely controlled reentry over the South Pacific. This analysis explores the scientific legacy, engineering decisions, and debris mitigation principles behind one of space exploration’s most responsible retirements.
- Committed Mediterranean Precipitation Decline: Why Emissions Cuts Alone Cannot Restore Winter RainsNew NOAA research reveals that Mediterranean winter rains may decline irreversibly even with emissions cuts. Explore the science of committed climate change and regional impacts.
- University Language Proficiency Exams: Why Institutional Tests Demand Different Preparation Than IELTS and TOEFLDiscover why university-specific language proficiency examinations differ fundamentally from IELTS and TOEFL, and learn strategic preparation approaches for institutional assessment success.
- CISA’s Ten-Advisory Wave: Why Generic Patching Fails in OT and How to Build Product-Specific PlaybooksCISA released ten ICS advisories in one week, exposing critical infrastructure risks. Generic patching fails in OT. Learn to build product-specific remediation playbooks.
- Mobile Learning and VR in English: What Global Evidence Reveals About Effective Language TechnologyA systematic review across 14 countries reveals which language-learning technologies genuinely work. Mobile learning, AI, and VR show measurable benefits when pedagogically integrated. This evidence-based guide helps educators and learners select technology that delivers real return on investment.
- Live Online English Classes for Kids: Do They Actually Reduce Anxiety?A ten-week study reveals that synchronous online English classes can significantly reduce child language anxiety while improving listening and reading skills. Discover what makes these programs effective and how parents can select the right one.
- Forbidden Matrix Patterns and Visible Lattice Points: A Geometric DictionaryExplore how multidimensional 0–1 matrices encode geometric truths, linking forbidden patterns to visible lattice points and hypergraph theory, with applications in combinatorics and computational geometry.
- How AI Agents Will Change the Way We Manage Personal FinancesExplore how AI agents are transforming personal finance through automated budgeting, bill payment, and investment management, while examining the critical security protocols and governance frameworks required for safe deployment.
- The Hidden Cost of AI Convenience: Why Over-Permissioned Agents Are a Security Time BombDiscover why AI agents with excessive permissions create dangerous single points of failure, and learn how implementing least privilege principles can protect your organization from exploitation.
RESOURCES
- Resources will be updated soon.
- 01
- 02
- 03
- 04
- 05
- 06
- 07
- 08
0 Comments