When a headline reports that falling oil prices lifted a stock market above the 168,000 level, the immediate temptation is to read it as a simple cause-and-effect story: cheaper crude, happier investors, rising index. That reading is not wrong, but it is incomplete. Oil is one of the most consequential inputs in the global economy, and its price movements ripple through transport costs, industrial margins, consumer spending power, inflation expectations, and ultimately the discount rates that investors apply to future corporate earnings. A single index milestone is therefore never just a number; it is a compressed signal of how capital is repricing risk across an entire economy.
The source report, attributed to Dawn, is deliberately spare. It confirms that a decline in oil prices helped push the market above the 168,000 threshold, but it offers no detail on the magnitude of the drop, the identity of the specific index, or the underlying reasons for the movement. That brevity is itself instructive. Financial journalism often compresses complex macro dynamics into a single sentence, and the analytical work of unpacking that sentence falls to the reader. Understanding what such a headline actually implies requires reconstructing the transmission channels between energy markets and equity valuations, and then testing how plausible each channel is in the current environment.
This analysis takes that reconstruction seriously. It examines why oil and equities so often move in opposite directions, how index thresholds acquire psychological and technical significance, what the 168,000 figure likely represents in a South Asian market context, and where the limits of a thin news report become analytically important. The goal is not to speculate beyond the evidence but to map the machinery that makes such a headline possible, so that future reports of the same kind can be read with sharper judgment and a clearer sense of what is being measured, what is being omitted, and what deserves follow-up scrutiny.
On This Page
TL;DR A Dawn report notes that easing oil prices helped lift a stock market above the 168,000 level, without specifying the index, the size of the decline, or the drivers behind it. This analysis explains the economic logic connecting crude prices to equity valuations, explores why round-number index thresholds matter psychologically and technically, and situates the 168,000 figure within the likely context of a South Asian benchmark such as the KSE-100. It also examines the analytical gaps in sparse financial reporting and outlines what investors should monitor next, including oil inventory data, central bank posture, currency stability, and sector-level earnings sensitivity.
The Economic Logic Linking Crude Prices to Equity Valuations
Oil occupies a peculiar position in any economy: it is simultaneously a consumer good, an industrial input, a geopolitical instrument, and a financial asset. When crude prices fall, the first-order effect is a transfer of purchasing power from oil exporters to oil importers. For a net-importing economy, that transfer functions like a broad, untargeted tax cut. Households spend less at the pump and retain more disposable income; manufacturers face lower freight and feedstock costs; airlines, cement producers, and chemical companies see margins expand. Equity markets, which price future cash flows, respond to this improvement in expected profitability well before the gains appear in reported earnings.
The second-order effects are equally important and considerably more subtle. Lower energy costs feed into headline inflation with a lag, and softer inflation expectations can persuade central banks to hold policy rates steady or begin easing. Because equity valuations are derived from discounting future cash flows, even a modest reduction in the risk-free rate can produce a disproportionate uplift in present values, particularly for long-duration growth stocks whose earnings lie far in the future. This is why oil-driven rallies often look larger than the direct cost savings would justify: the market is not merely repricing input costs but repricing the entire interest rate path.
There is, however, a countervailing channel that prevents the relationship from being mechanical. Falling oil prices can signal weakening global demand rather than abundant supply, and in that case the equity response may be negative despite cheaper energy. Distinguishing between a supply-driven decline, which is generally bullish for importers, and a demand-driven decline, which often precedes recessions, is the single most important analytical judgment in reading any oil-equity headline. The Dawn report does not specify which dynamic was at work, and that omission materially limits how confidently the rally can be interpreted as a durable improvement in fundamentals.
Supply Shocks Versus Demand Shocks
The distinction between supply and demand shocks deserves closer attention because it determines whether an oil decline is genuinely good news for equities. A supply-driven fall, whether from OPEC+ production increases, the return of sanctioned barrels, or unexpected inventory builds, lowers costs without impairing global activity. Importing economies gain on both the inflation and growth fronts, and equity markets typically rally with breadth. A demand-driven fall, by contrast, often emerges from slowing industrial production in major economies, and the cost relief it delivers is overwhelmed by the deterioration in revenue expectations across cyclical sectors.
Analysts therefore look for corroborating evidence before endorsing an oil-led rally. Rising freight volumes, stable purchasing managers' indices, and firm copper prices all suggest that demand remains intact and the oil decline is supply-side. Falling bond yields alongside falling oil, particularly when credit spreads widen, suggest the opposite. The Dawn report provides none of this context, which means the 168,000 milestone should be treated as a factual observation rather than a validated signal of improving fundamentals until corroborating data emerge.
Currency and Fiscal Overlays in Importing Economies
For economies that import the bulk of their crude, the oil price is only half of the equation; the exchange rate is the other half. The local-currency cost of a barrel is the dollar price multiplied by the exchange rate, so a falling rupee or lira can neutralize or even reverse the benefit of cheaper crude. This is why oil-importing emerging markets sometimes fail to rally on falling oil prices: the currency is depreciating faster than crude is falling, and the effective input cost is unchanged or higher. Investors watching index milestones must therefore track the two variables together rather than in isolation.
Fiscal policy adds another layer. Many importing governments subsidize fuel, which means the benefit of lower crude prices accrues to the treasury rather than directly to consumers until subsidies are adjusted. A government that seizes the windfall to narrow its deficit may improve sovereign credibility and bond yields, indirectly supporting equities, while one that passes the savings to consumers supports near-term spending. The distributional choice shapes which sectors benefit and how quickly the index-level effect materializes, and it is precisely the kind of detail that a one-sentence market report cannot capture.
We Also Published
Why Round-Number Index Thresholds Command Attention
The 168,000 level is not economically meaningful in any fundamental sense. No valuation model assigns special significance to a five-digit round number, and corporate earnings do not change because an index crosses a threshold. Yet thresholds command attention because markets are social systems as much as they are pricing mechanisms. Round numbers serve as coordination points for media coverage, retail investor attention, and trading behavior. When an index approaches a widely watched level, the resulting commentary generates its own momentum, drawing in flows that can validate the very move being discussed.
This reflexive quality is well documented in behavioral finance. Investors exhibit anchoring effects, treating recent round numbers as reference points against which gains and losses are measured. Technical traders watch for breakouts above such levels, and algorithmic strategies often incorporate round-number filters. The result is that thresholds can function as short-term support or resistance even though they carry no intrinsic information. A headline celebrating a move above 168,000 is therefore partly reporting a fact and partly participating in the psychological process that makes the fact consequential.
Anchoring, Attention, and Retail Flows
Retail investor behavior amplifies threshold effects in markets where participation is broad and information is uneven. A headline announcing that the index has crossed 168,000 reaches readers who may not follow daily price action, and it frames the market as having achieved something. That framing can prompt new inflows from savers who had been waiting on the sidelines, particularly in markets where mutual fund marketing leans heavily on index milestones. The resulting demand is real, even if its origin is psychological, and it can sustain a rally beyond what fundamentals alone would support.
The risk is asymmetry. Threshold-driven inflows tend to arrive after a move has already occurred, which means late entrants bear more downside if the catalyst reverses. When oil prices rebound or the currency weakens, the same round number that attracted attention becomes a reference point for disappointment, and exits can be as reflexive as entries. Understanding this dynamic does not require predicting it precisely; it requires recognizing that index milestones are sentiment events layered on top of fundamental events, and that the two can diverge over short horizons.
Technical Significance and Algorithmic Trading
Modern market microstructure gives round numbers a second life. Many algorithmic execution strategies use round-number levels as reference points for order placement, and stop-loss clusters frequently accumulate just below psychologically significant thresholds. When an index clears 168,000, the resulting cascade of triggered orders can amplify the move in ways unrelated to any change in expected cash flows. This mechanical amplification is a well-known feature of electronic markets and explains why breakouts often occur with unusual volume before settling into a new range.
For analysts, the practical implication is that a threshold breach should be decomposed into its fundamental and technical components. If the rally is accompanied by broad sector participation, improving earnings revisions, and stable currency conditions, the technical breakout is likely reinforcing a genuine repricing. If instead the move is narrow, concentrated in a few index heavyweights, and accompanied by thin volume outside the breakout session, the threshold may be doing more work than the fundamentals. The Dawn report does not supply the data needed to make this distinction.
Locating the 168,000 Figure in Market Context
Index levels are only interpretable relative to the market they belong to. A reading of 168,000 is enormous by the standards of the S&P 500 or the FTSE 100, which trade in the thousands, but entirely ordinary for benchmarks that use a different base and weighting methodology. The Karachi Stock Exchange's KSE-100 index, for instance, has traded in the six figures for years, and Dawn is a Pakistani publication, which makes the KSE-100 the most plausible referent for the report. Other candidates, such as the Bursa Malaysia KLCI or the Jakarta Composite, trade at far lower levels and do not fit the figure.
Establishing this context matters because the interpretation of an oil-driven rally depends heavily on the structure of the domestic economy. Pakistan is a substantial net importer of crude and refined products, so falling oil prices improve its trade balance, ease pressure on foreign reserves, and reduce the import bill that weighs on the currency. For an economy navigating balance-of-payments constraints, an oil decline is not merely a marginal cost saving but a macro-financial relief valve, and equity markets tend to price that relief quickly and visibly.
The KSE-100 and Pakistan's Energy Import Dependence
Pakistan's energy import bill has long been one of the most volatile components of its external accounts, and movements in crude prices transmit directly into the current account deficit, foreign exchange reserves, and the rupee's stability. When oil falls, the immediate relief is felt in the import bill, and the secondary relief is felt in inflation expectations, which in turn shape the central bank's willingness to cut policy rates. Equity markets in such economies are highly sensitive to the rate path, so an oil decline can trigger a rally that is only partly about energy costs and largely about monetary easing prospects.
The composition of the KSE-100 matters as well. The index is weighted toward banks, energy companies, fertilizer producers, and cement manufacturers, sectors with divergent sensitivities to oil. Banks benefit from lower inflation and rate cuts; energy exploration companies may suffer from lower realizations; cement and fertilizer gain from cheaper fuel and feedstock. A rally above 168,000 therefore reflects a net assessment across these sectors rather than a uniform improvement, and the breadth of the move would reveal which narrative dominated. The report does not provide that breadth data.
- 01
- 02
- 03
- 04
Comparative Perspective on Emerging Market Index Levels
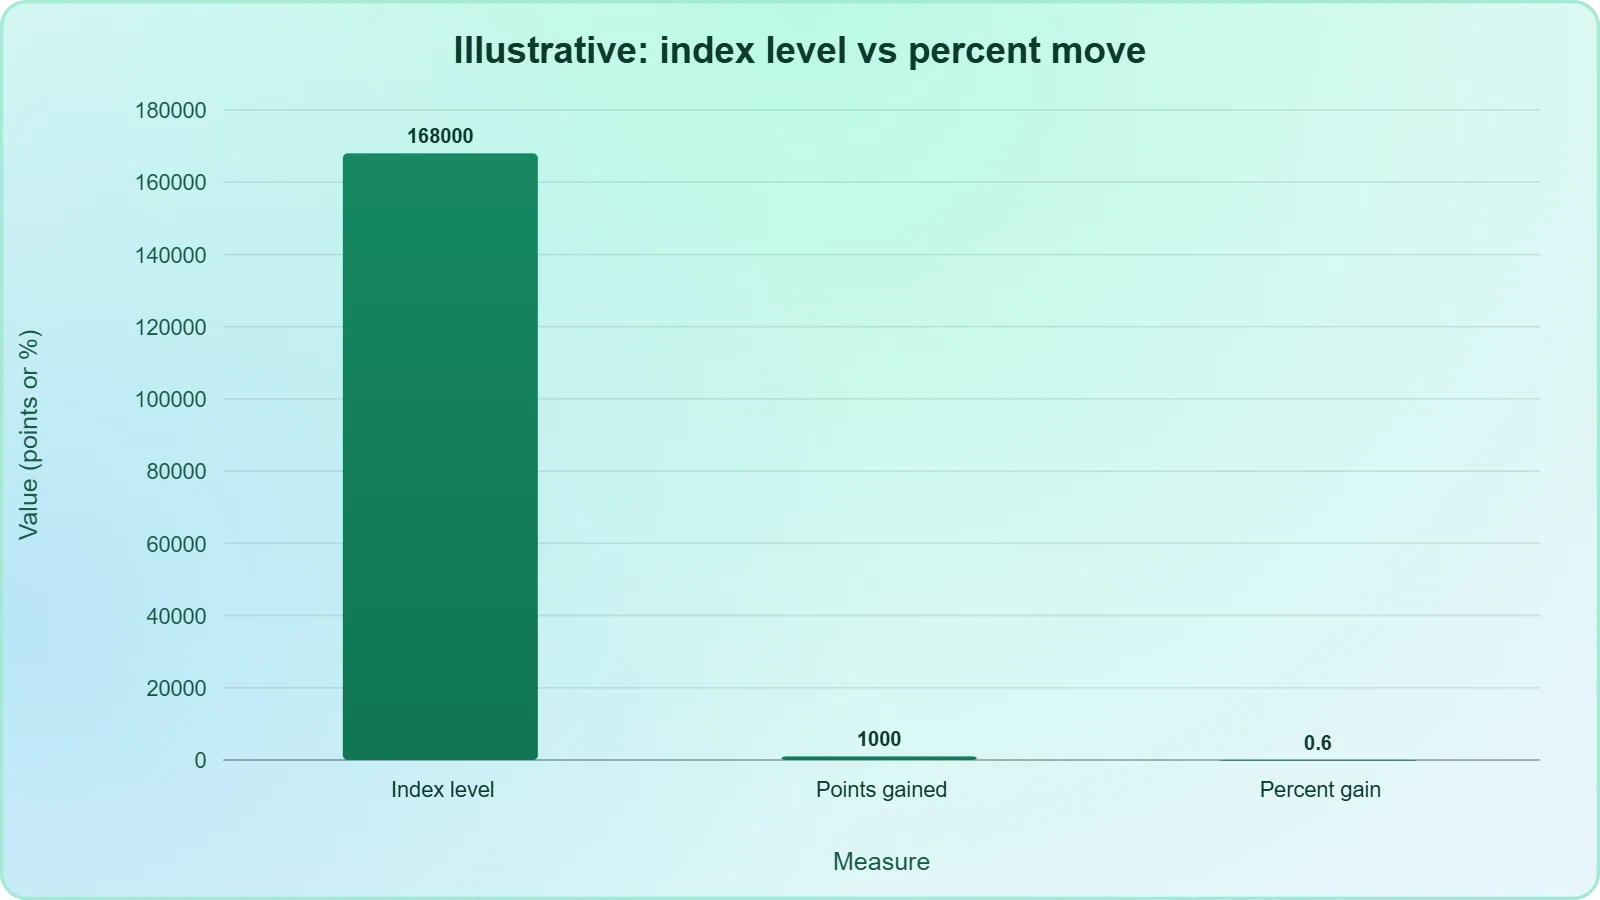
Placing 168,000 in comparative perspective helps guard against misreading the number as extraordinary. Several emerging market benchmarks trade at five or six figures because of their base-year construction and the number of constituents, not because their constituent companies are larger or more valuable. The KSE-100, for example, has a base value of 1,000 established in 1991, and decades of nominal growth have pushed the level into six figures. A reader unfamiliar with this convention might mistake the figure for a sign of exceptional market performance when it is largely an artifact of index design.
What matters analytically is the percentage change, not the absolute level. A move from 167,000 to 168,000 is a gain of roughly 0.6 percent, which is a routine daily fluctuation in most markets. The headline's emphasis on the threshold rather than the percentage is a journalistic choice that foregrounds the psychological milestone over the economic magnitude. Recognizing this helps readers calibrate their reaction: crossing 168,000 is noteworthy as a sentiment event, but it is not evidence of a dramatic repricing unless the accompanying percentage move and volume data say so.
Reading Sparse Financial Reporting with Analytical Discipline
Financial journalism operates under constraints that shape what reaches the reader. Wire services and newspapers publish hundreds of market updates daily, often under tight deadlines and with limited space, and the resulting reports frequently reduce complex sessions to a sentence or two. This is not necessarily a failure of rigor; it is a structural feature of news production. The consequence, however, is that readers who rely on such reports for investment decisions are working with an incomplete picture and must supply the missing context themselves or seek it elsewhere.
The disciplined response is to treat a sparse report as a pointer rather than a conclusion. The headline tells you that something happened and identifies one plausible driver; it does not tell you the magnitude, the mechanism, or the durability. A reader who internalizes this distinction will instinctively ask follow-up questions: How large was the oil move? Was it supply or demand driven? What did the currency do? Which sectors led the rally? Did volume confirm the move? These questions are not pedantic; they are the difference between reacting to a headline and understanding a market.
Information Gaps and Their Practical Consequences
Information gaps are not neutral; they impose costs on readers who act without filling them. An investor who buys on the headline alone may be responding to a supply-driven decline that is genuinely bullish, or to a demand-driven decline that is a warning sign, and the two scenarios are indistinguishable from the text. The cost of that ambiguity is asymmetric because the downside scenario is precisely the one in which equity markets fall after the headline has already encouraged buying. Filling the gap requires only a few minutes of checking oil futures, currency quotes, and sector performance.
Institutional investors have entire research desks devoted to this verification, but retail investors often do not. The practical remedy is to build a small routine: when a market headline cites a single driver, check at least two corroborating data points before drawing conclusions. Over time, this habit converts sparse reporting from a source of noise into a useful alert system, one that flags events worth investigating rather than events worth acting on immediately. The discipline is simple, but it is the difference between informed participation and reactive trading.
Building a Monitoring Framework for Energy-Sensitive Markets
A durable monitoring framework for energy-sensitive equity markets rests on a handful of recurring data releases. Weekly crude inventories from major agencies indicate whether supply is tightening or loosening; OPEC+ communiqués signal production intentions; currency reserves and current account data reveal how the oil bill is affecting external balances; and central bank statements translate energy costs into policy expectations. Tracking these four streams provides most of the context that a one-sentence market report omits, and it does so on a predictable schedule that supports disciplined decision-making.
Sector-level monitoring adds the final layer. In an oil-importing economy, banks, cement, fertilizer, and transport companies carry different sensitivities, and their relative performance during an oil decline reveals which transmission channel the market believes is dominant. If banks lead, the market is pricing rate cuts; if cement and transport lead, it is pricing input cost relief; if energy explorers lag sharply, the market is acknowledging revenue losses. Reading these rotations correctly turns a vague index milestone into a specific, testable thesis about where the next phase of the rally will concentrate.
What the 168,000 Milestone Signals and What It Does Not
The most defensible reading of the Dawn report is that it records a real market event with a plausible and well-established driver, while leaving the magnitude, mechanism, and durability unspecified. Falling oil prices genuinely do support equity markets in net-importing economies through cost relief, inflation moderation, and easier monetary policy, and a move above a psychologically significant threshold is consistent with those forces being at work. That much can be said with confidence. What cannot be said is whether the rally reflects a durable improvement in fundamentals or a transient reaction to a supply-side price swing.
The distinction matters because the two scenarios imply different portfolio decisions. A durable, supply-driven improvement argues for maintaining exposure to rate-sensitive and input-cost-sensitive sectors, while a transient reaction argues for caution and for watching the currency and external accounts closely. The report provides no basis for choosing between them, and intellectual honesty requires acknowledging that limitation rather than projecting confidence the evidence does not support. The milestone is a signal worth noting, not a verdict worth acting on without further verification.
Implications for Investors and Policymakers
For investors, the practical takeaway is to treat oil-driven index milestones as invitations to verify rather than as buy signals. The sectors most likely to benefit from a genuine supply-driven decline are those with high energy intensity and rate sensitivity, and their relative performance during the rally is the best available evidence of what the market believes. Policymakers face a parallel task: a falling oil price offers a window to rebuild reserves, adjust subsidy frameworks, and lock in disinflation, but only if the decline proves durable. Acting as though it will last, without evidence, risks squandering the relief.
Both groups should also watch for the reversal scenario. Oil prices are volatile, and a supply-driven decline can reverse quickly if producers respond with output cuts or if geopolitical disruptions emerge. An equity market that has rallied on cheaper crude can give back gains just as rapidly, and the round-number threshold that framed the advance will frame the retreat. Building contingency plans around that possibility is not pessimism; it is the ordinary discipline that separates durable portfolio construction from momentum chasing.
The Broader Lesson for Financial Literacy
The deeper lesson of this episode concerns financial literacy. A one-sentence market report is a compressed artifact of a complex system, and the ability to unpack it is a skill worth cultivating. Readers who understand the transmission channels between oil, inflation, rates, and equities can extract far more from a sparse headline than those who take it at face value. They can identify which claims are supported, which are inferred, and which are simply absent, and they can calibrate their confidence accordingly. That skill compounds over time and pays dividends across every market cycle.
Financial literacy also includes knowing when to seek expert input. A retail investor who recognizes the limits of a headline can consult research reports, central bank statements, and commodity analysts rather than relying on a single sentence. The willingness to acknowledge uncertainty is not a weakness; it is the foundation of sound judgment. The 168,000 milestone, read carefully, teaches exactly this: that markets are legible only when we supply the context that headlines leave out, and that the discipline of asking better questions is the most reliable edge available to any investor.
From our network :
- How AI Agents Will Change the Way We Manage Personal FinancesExplore how AI agents are transforming personal finance through automated budgeting, bill payment, and investment management, while examining the critical security protocols and governance frameworks required for safe deployment.
- Forbidden Matrix Patterns and Visible Lattice Points: A Geometric DictionaryExplore how multidimensional 0–1 matrices encode geometric truths, linking forbidden patterns to visible lattice points and hypergraph theory, with applications in combinatorics and computational geometry.
- The Hidden Cost of AI Convenience: Why Over-Permissioned Agents Are a Security Time BombDiscover why AI agents with excessive permissions create dangerous single points of failure, and learn how implementing least privilege principles can protect your organization from exploitation.
- Live Online English Classes for Kids: Do They Actually Reduce Anxiety?A ten-week study reveals that synchronous online English classes can significantly reduce child language anxiety while improving listening and reading skills. Discover what makes these programs effective and how parents can select the right one.
- University Language Proficiency Exams: Why Institutional Tests Demand Different Preparation Than IELTS and TOEFLDiscover why university-specific language proficiency examinations differ fundamentally from IELTS and TOEFL, and learn strategic preparation approaches for institutional assessment success.
- Mobile Learning and VR in English: What Global Evidence Reveals About Effective Language TechnologyA systematic review across 14 countries reveals which language-learning technologies genuinely work. Mobile learning, AI, and VR show measurable benefits when pedagogically integrated. This evidence-based guide helps educators and learners select technology that delivers real return on investment.
- The Final Descent: How ESA Retired the Legendary Cluster Constellation After 24 Years of Space Weather ScienceAfter 24 years mapping Earth’s magnetosphere, ESA’s Cluster mission concluded with a precisely controlled reentry over the South Pacific. This analysis explores the scientific legacy, engineering decisions, and debris mitigation principles behind one of space exploration’s most responsible retirements.
- Committed Mediterranean Precipitation Decline: Why Emissions Cuts Alone Cannot Restore Winter RainsNew NOAA research reveals that Mediterranean winter rains may decline irreversibly even with emissions cuts. Explore the science of committed climate change and regional impacts.
- CISA’s Ten-Advisory Wave: Why Generic Patching Fails in OT and How to Build Product-Specific PlaybooksCISA released ten ICS advisories in one week, exposing critical infrastructure risks. Generic patching fails in OT. Learn to build product-specific remediation playbooks.
RESOURCES
- Resources will be updated soon.
- 01
- 02
- 03
- 04
- 05
- 06
- 07
- 08
0 Comments