The Nifty 50 session on 2 November 2026 delivered a broadly positive tape, with advancing stocks comfortably outnumbering decliners across the fifty constituents tracked by NSE data. Thirty-eight of the fifty names closed higher, a ratio that speaks to genuine participation rather than a narrow, index-heavy lift.
The median stock gained +1.01% on the day, a reading that matters because it describes the typical constituent rather than the average, which can be distorted by a single outsized move. Breadth of this kind tells readers how widely a session's direction was shared across the index.
That median figure sits at the heart of the day's story. When the typical stock rises by roughly one percent while a handful of names post far larger moves, the session reflects a market where gains were distributed rather than concentrated.
On This Page
Reliance Industries led the field with a striking +11.60% advance on volume 4.7× its 20-day average, a combination that drew attention to both price and participation. Against this, Infosys slipped -2.03%, and a small cluster of banks and defensives edged lower, giving the session a two-sided character.
This wrap reads the verified end-of-day numbers exactly as computed, describing what breadth, movers, volume and one-year performance showed on the date. It explains each measure in plain language so ordinary readers can follow the arithmetic without prior training.
No causes are assigned to any move, and no forward view is offered; the figures are presented as observations of past prices. The aim is clarity about what the data recorded, not interpretation of why it happened.
TL;DR On 2 November 2026, 38 of 50 Nifty 50 stocks advanced and 12 declined, with the median stock up +1.01%; RELIANCE led gainers at +11.60% on 4.7× average volume while INFY fell -2.03%.
The Session in Brief: Breadth and the Median Move
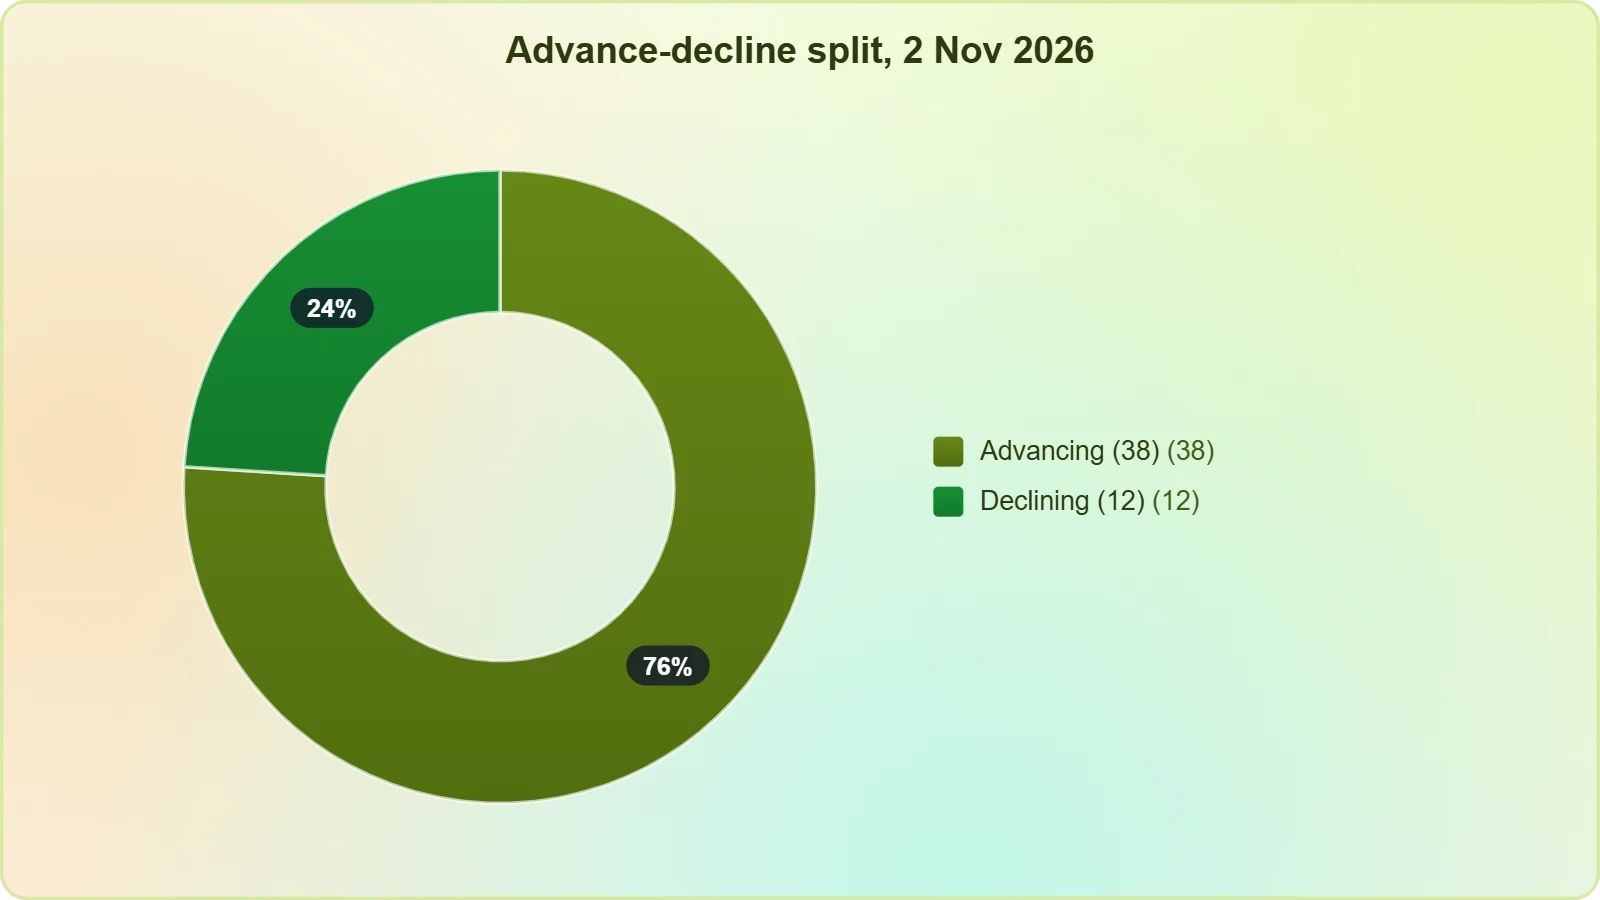
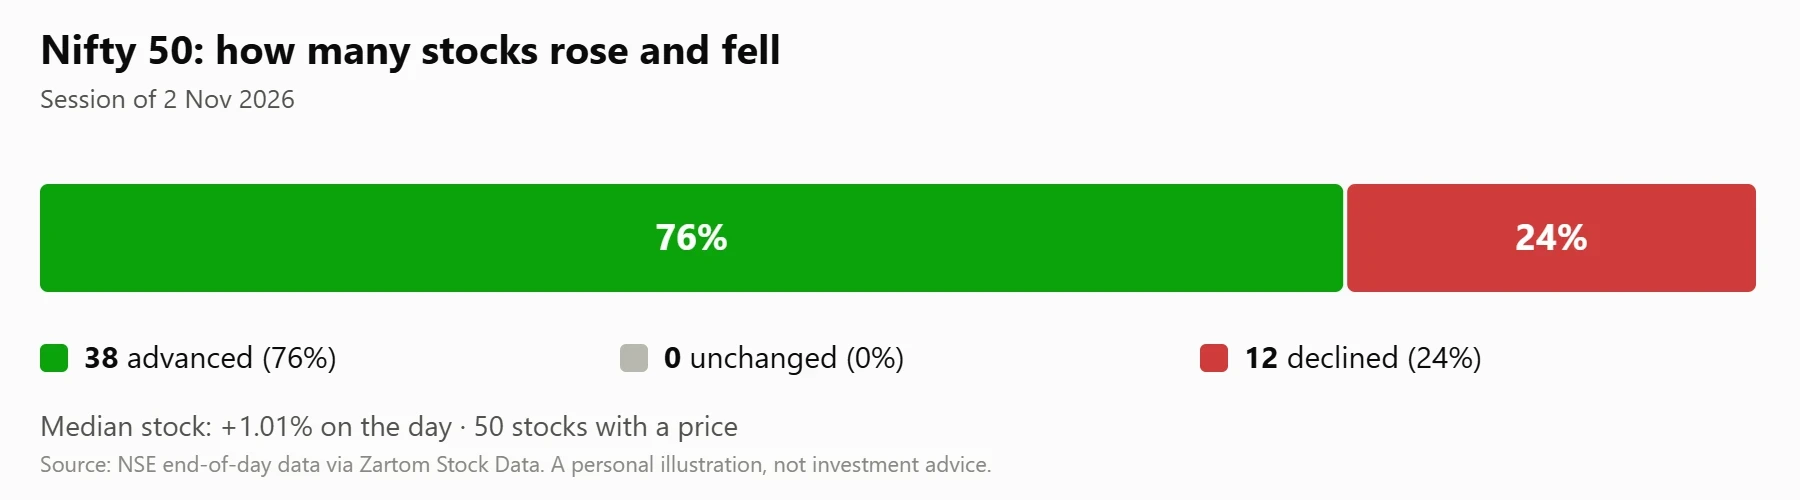
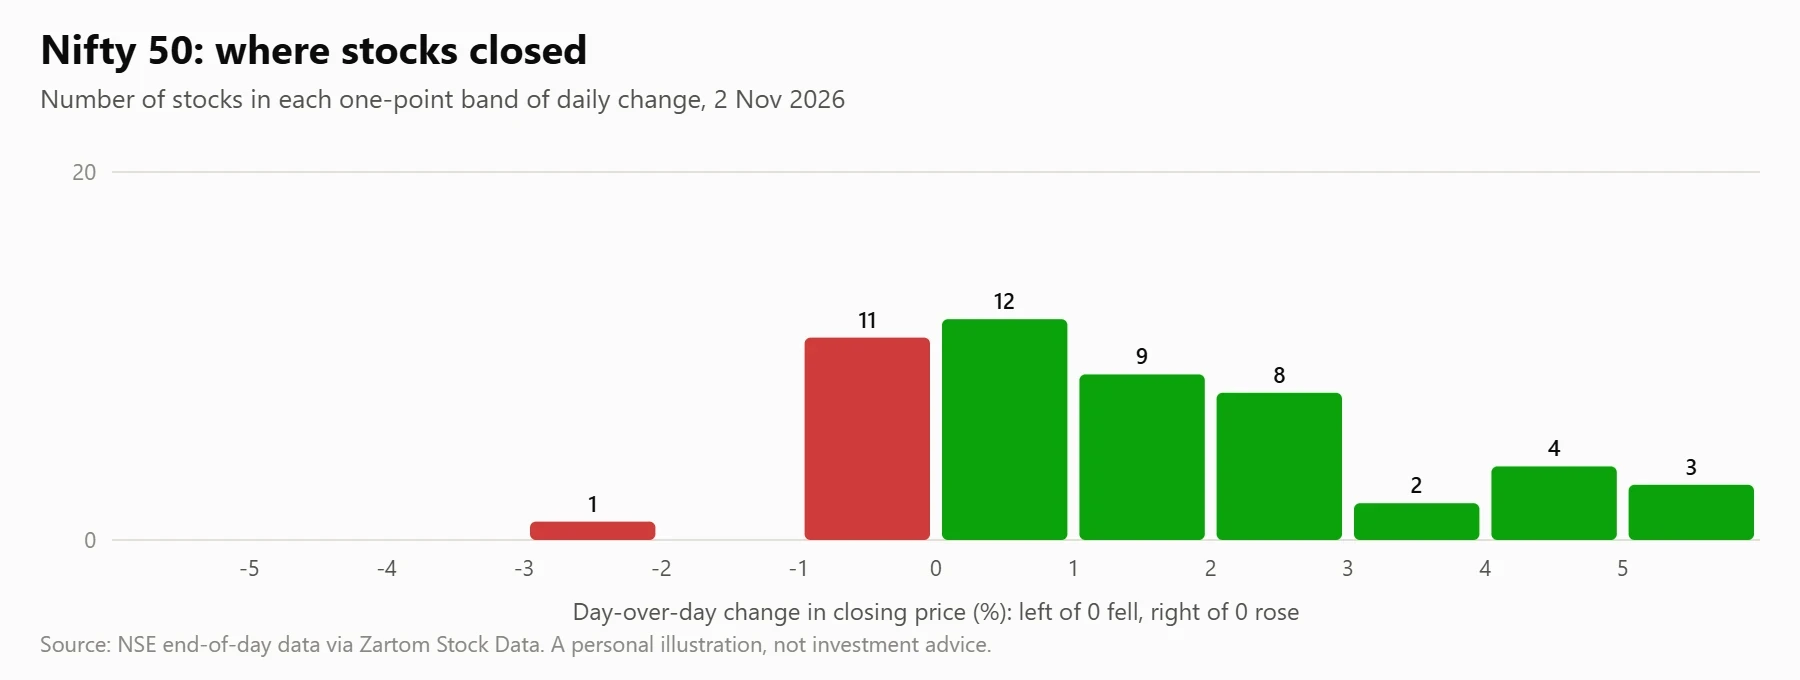
The headline arithmetic of the day is simple and telling. Of the fifty constituents, 38 rose and 12 fell, with none unchanged, producing an advance-decline ratio of roughly three to one.
Market breadth, which simply counts how many stocks rise against how many fall, is one of the cleanest ways to judge whether a session's direction was widely shared. A ratio this lopsided indicates that gains were not confined to a few heavyweights.
The median stock moved +1.01%, meaning the middle-ranked performer among all fifty gained about one percent. This measure differs from a simple average because it ignores the size of extreme moves and reports the typical experience.
When the median is positive and close to one percent, the ordinary constituent participated in the advance rather than sitting out while a handful of names carried the index.
Reading the Advance-Decline Split
An advance-decline reading of 38 to 12 describes a session where buyers were active across the breadth of the index. Traders watch this split because a rising index backed by broad participation is structurally different from one lifted by a single stock.
Here, the count itself is the fact; the interpretation of what it signals about future direction is deliberately left aside.
The absence of any unchanged stocks is a small but notable detail. It means every one of the fifty names closed either above or below its previous close, with no flat finishes to blur the picture.
That clean split makes the 76% advance share and 24% decline share straightforward to read and easy to compare against other sessions.
What the Median Tells Us
The median of +1.01% is the single most representative number for the typical stock's day. Because it sits at the midpoint of all fifty changes, half the constituents did better and half did worse.
It is a sturdier guide to the session's texture than an average, which a single +11.60% move can pull upward disproportionately.
Comparing the median against the biggest movers shows the shape of the distribution. A typical gain near one percent alongside one stock up +11.60% and another down -2.03% describes a session with a long right tail.
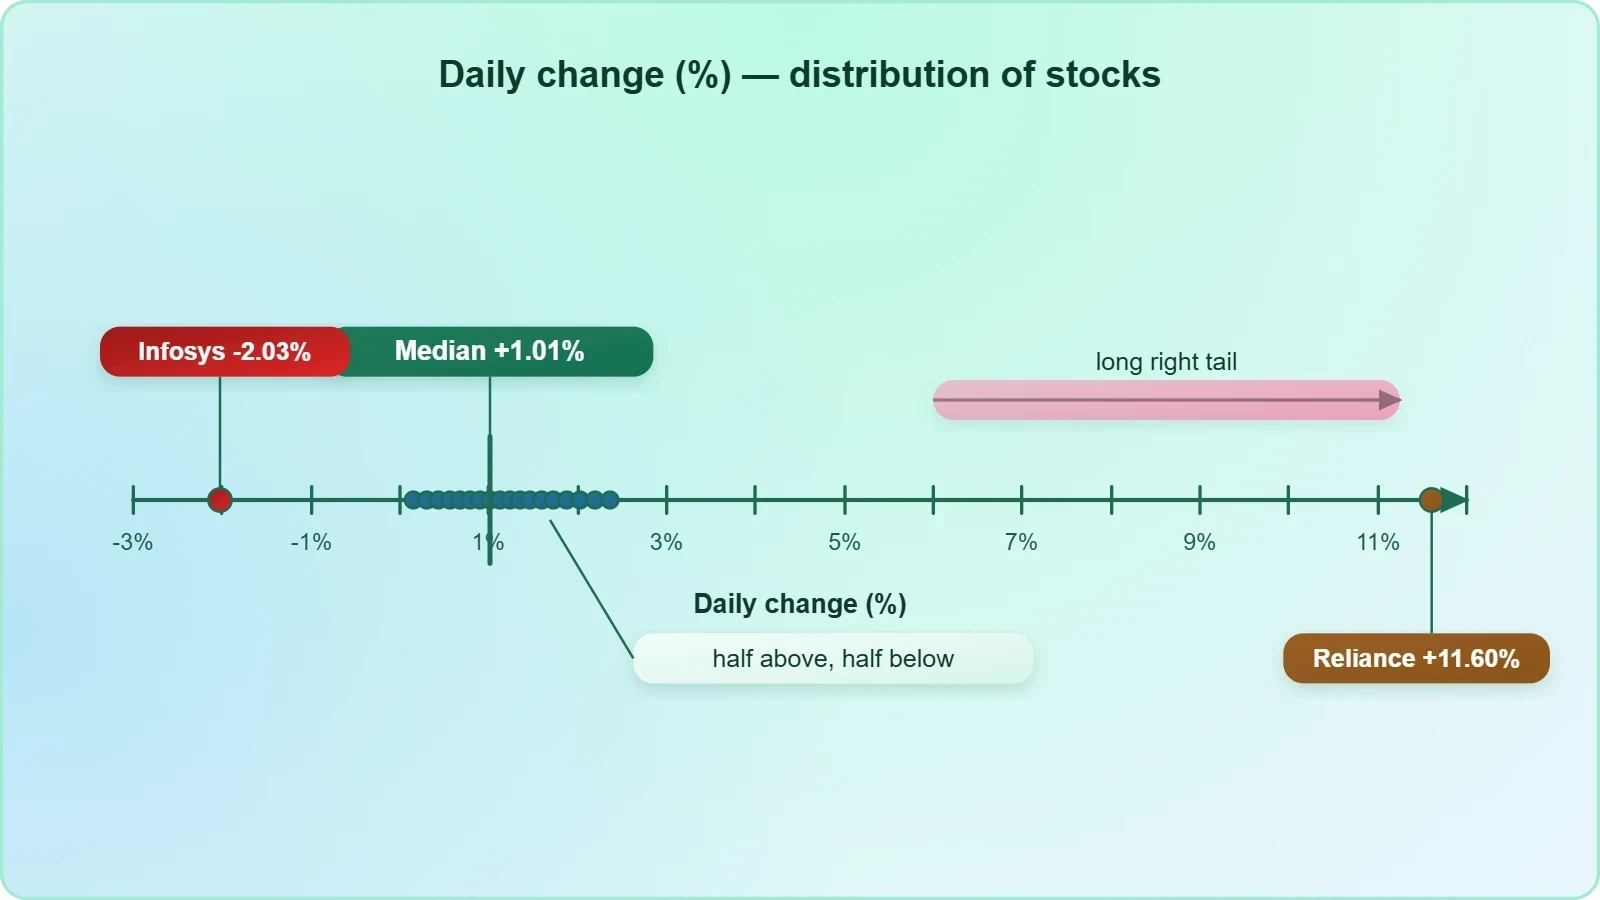
The histogram of daily changes makes this spread visible, showing how the fifty outcomes clustered around the middle.
Biggest Gainers: Reliance Leads a Broad Advance
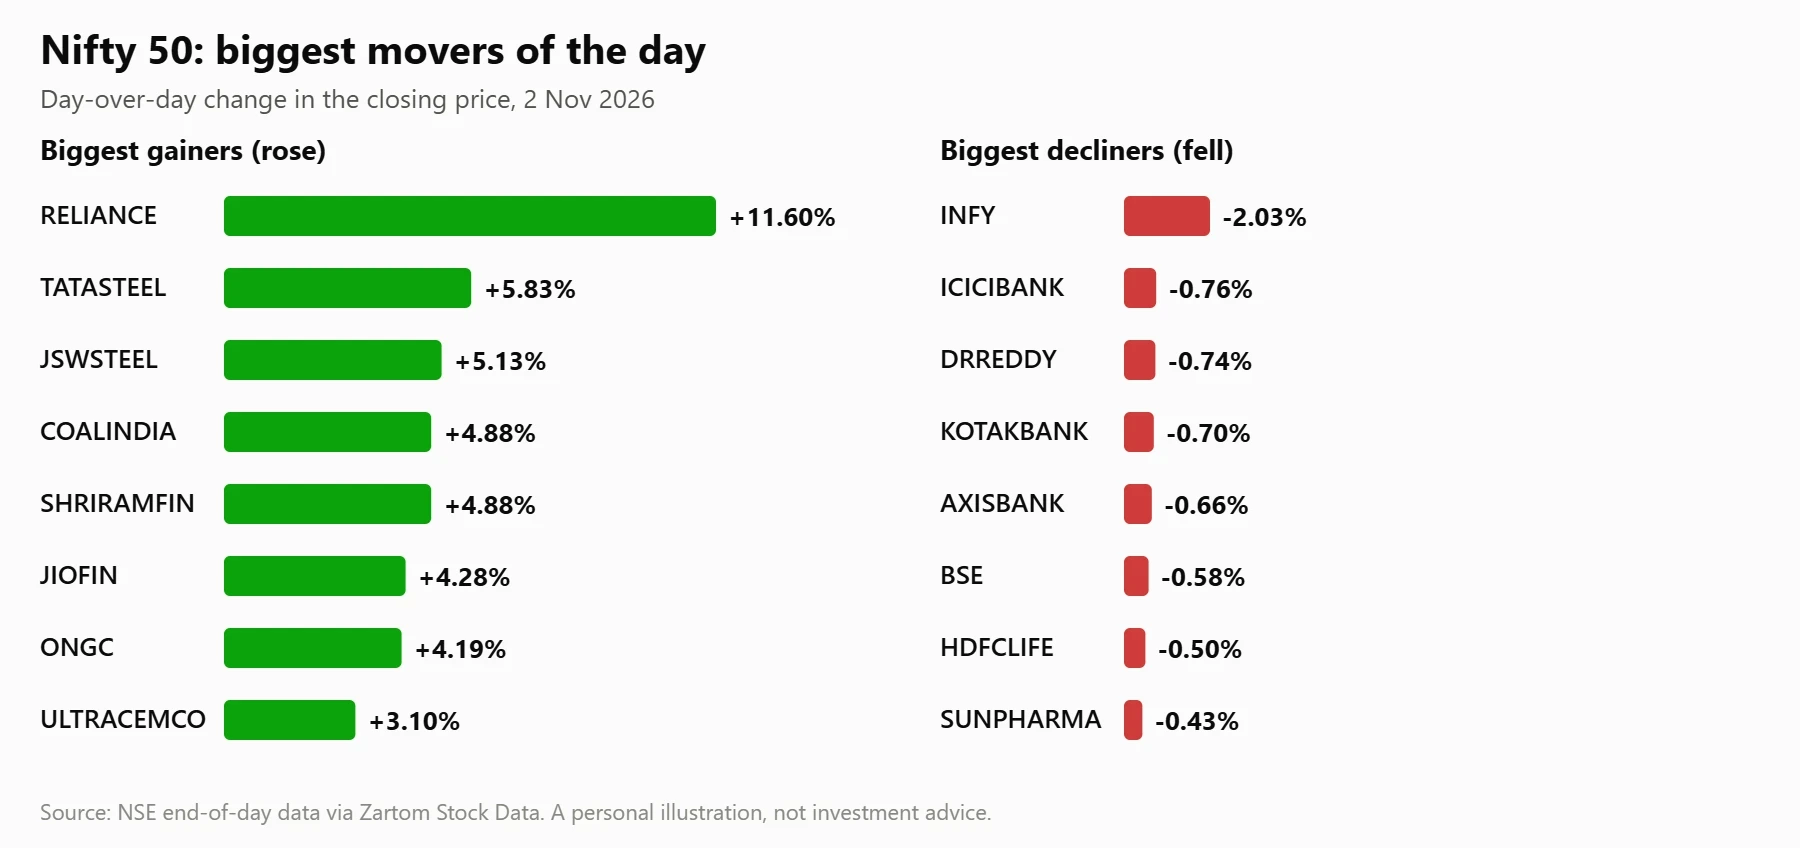
The gainers' list was topped by a single outsized move and then a cluster of solid, single-digit advances spread across metals, energy, financials and cement. Reliance Industries' +11.60% stood far clear of the field, while the next names posted gains in the three-to-six percent range.
This mix of one dominant mover and a broad supporting cast is what gave the session its wide breadth.
Steel and metal names featured prominently among the leaders, with Tata Steel and JSW Steel both advancing strongly. Energy-linked constituents such as Coal India and ONGC also appeared, alongside financial names like Shriram Finance and Jio Financial Services. The spread across sectors suggests the advance was not confined to one corner of the market.
The Day's Top Ten Gainers
The table below lists the ten largest gainers with their closing prices, day-over-day changes and one-month performance. Each figure is reproduced exactly as computed, allowing readers to see both the single-session move and the broader monthly context side by side.
Reliance's Volume Surge
Reliance Industries closed at ₹1,300.00, up +11.60% on the day and +11.3% over one month, with volume at 4.7× its 20-day average. The 20-day average volume is simply the mean number of shares traded over the past twenty sessions, so a multiple of 4.7× marks participation far above the recent norm. Heavy volume alongside a large price move is a pairing that draws close attention.
Only two stocks in the index traded at least twice their 20-day average volume, and Reliance was one of them. The other was Sun Pharmaceutical, at 2.0× average, even as its price slipped -0.43%.
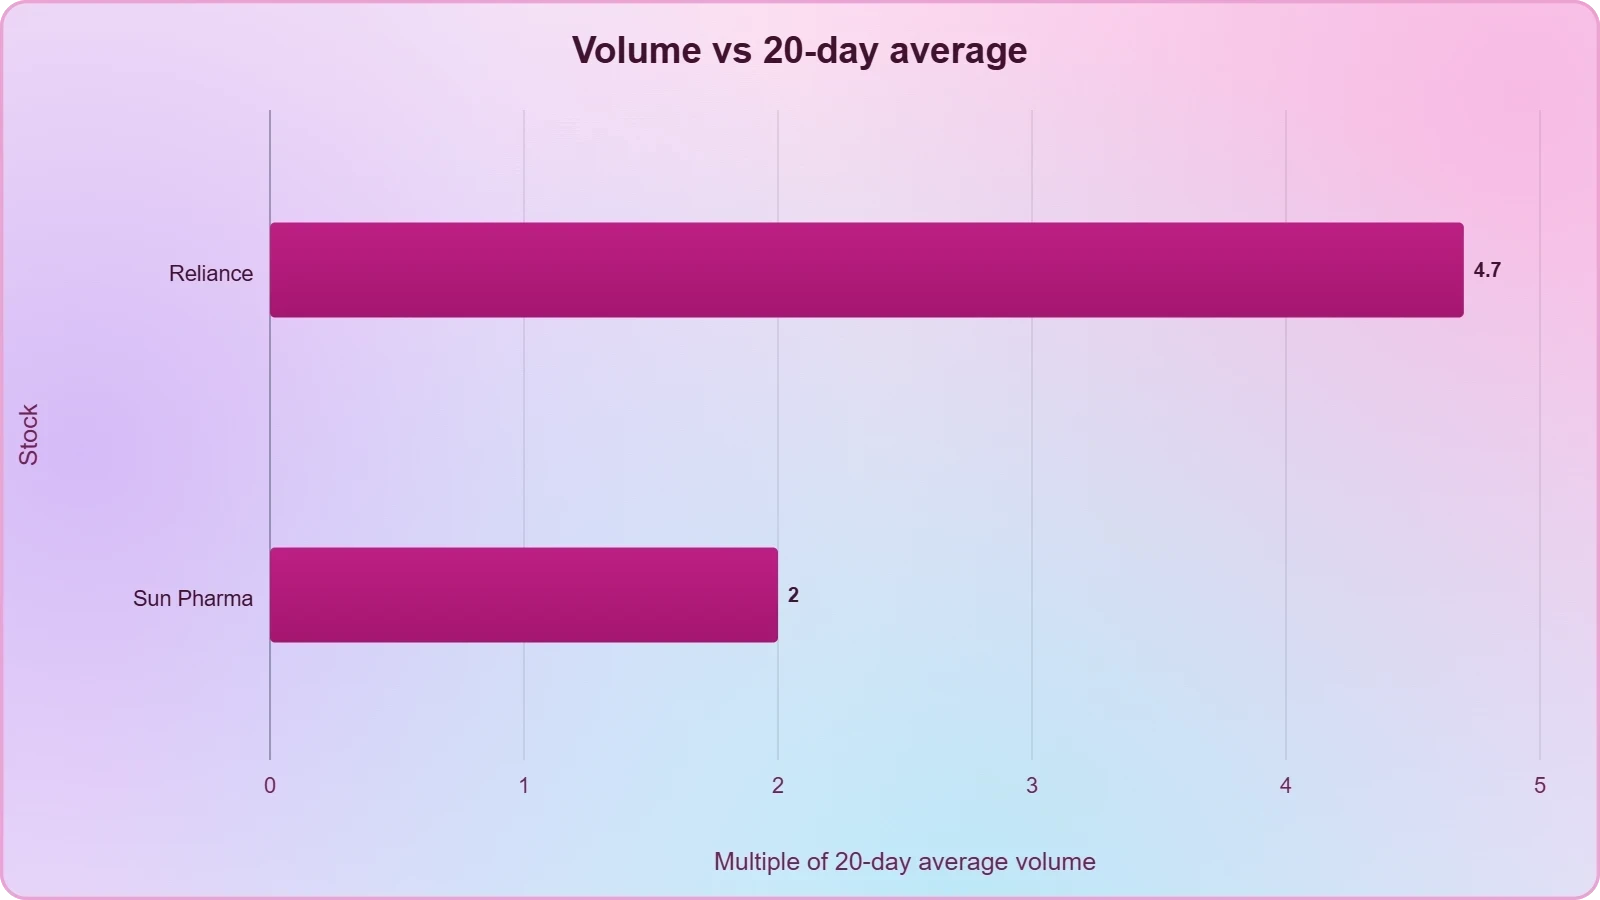
Volume surges of this kind describe how actively a stock changed hands relative to its own recent history, not what the activity means for the future.
Biggest Decliners: Banks and Defensives Slip
The decliners' side was led by Infosys at -2.03%, with the remaining names posting modest single-session losses of under one percent. ICICI Bank, Dr. Reddy's, Kotak Mahindra Bank and Axis Bank all edged lower, giving the session a two-sided feel despite the strong breadth. These small declines contrast sharply with the double-digit gain at the top of the leaderboard.
Several of the decliners had actually risen over the past month, which adds context to a single down day. Infosys was up +12.2% over one month, Dr. Reddy's +11.3% and Kotak Mahindra Bank +9.6%, so their one-day slips sit within a longer stretch of gains. The day's move and the monthly move describe different windows and should be read separately.
The Day's Ten Decliners
The table below sets out the ten largest decliners with closing prices, day changes and one-month performance. Presenting both windows together shows how a single weak session can sit inside a stronger monthly trend, or the reverse.
Infosys and the Bank Cluster
Infosys was the only constituent to fall more than one percent, closing at ₹1,161.00 for a -2.03% day. Its one-month change of +12.2% shows the stock had risen over the preceding month, so the single-session loss sits within a longer advance. The remaining decliners were banks and defensives with losses well under one percent.
ICICI Bank, Kotak Mahindra Bank and Axis Bank all closed modestly lower, a cluster that gave the financial space a mixed look on a day when other financial names rose. Shriram Finance and Jio Financial Services both advanced, so the sector's performance was split rather than uniform. This divergence within a sector is common and worth noting when reading breadth.
- 01
- 02
- 03
- 04
Stocks Near 52-Week Highs and Lows
Three stocks closed within two percent of their 52-week high, while none closed within two percent of a 52-week low. A 52-week high is simply the highest price a stock has traded at over the past year, and proximity to it describes where the current close sits within that annual range. The absence of names near annual lows rounds out a session tilted toward strength.
The three names near their highs were Adani Ports, Kotak Mahindra Bank and Eternal. Notably, Kotak Mahindra Bank appeared here even as it slipped -0.70% on the day, showing that a small decline can still leave a stock close to its annual peak.
This overlap between the decliners' list and the near-high list is a useful reminder that one day's move is a narrow lens.
The Names Near Annual Highs
The table below lists the three constituents within two percent of their 52-week high, with closing prices, day changes and the high itself. The gap between close and high shows how near each stock sat to its annual peak on the date.
What Proximity to Highs Measures
Distance from a 52-week high is a simple positional measure: it tells readers where the latest close sits within the past year's range. A stock within two percent of its high has spent recent sessions near the top of that range. The measure describes position, not direction, and says nothing about where the price goes next.
With three names near annual highs and none near annual lows, the index's constituents were positioned toward the upper end of their yearly ranges on this date. That tilt is consistent with the broad advance seen in the breadth count. It is a snapshot of position at the close, not a forecast of continuation.
One-Year Performance: Leaders and Laggards
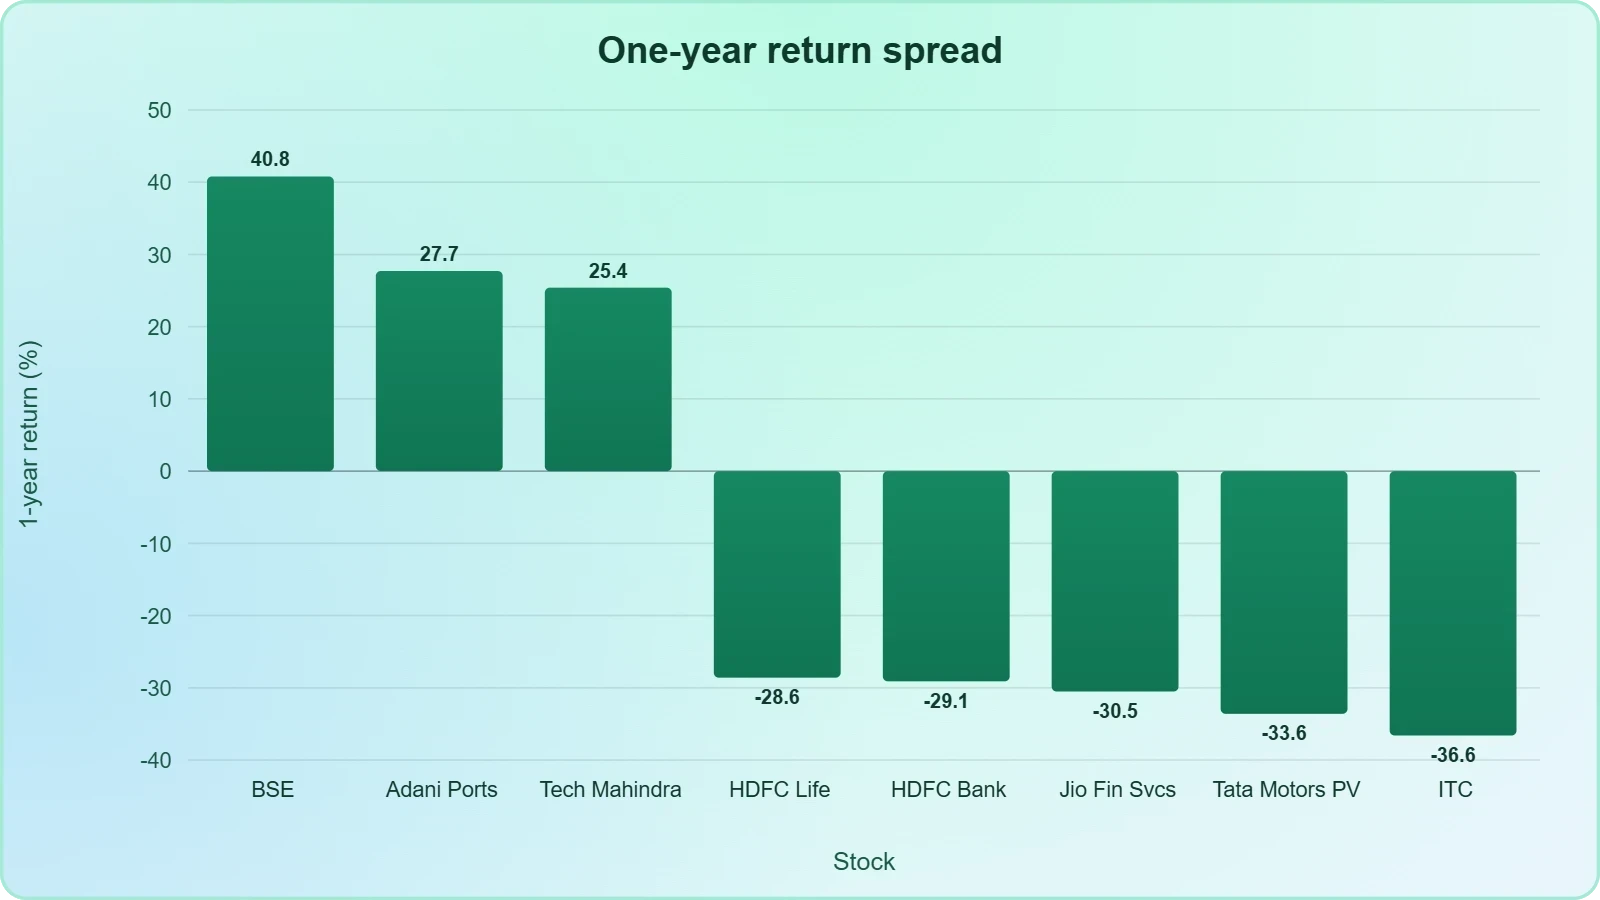
Over the trailing twelve months, the strongest performers were led by BSE at +40.8%, followed by Adani Ports at +27.7% and Tech Mahindra at +25.4%. A one-year return simply compares the latest close with the price a year earlier, capturing a much longer window than a single session. These figures show which constituents had travelled furthest over the year.
At the other end, ITC was the weakest at -36.6%, with Tata Motors Passenger Vehicles at -33.6%, Jio Financial Services at -30.5%, HDFC Bank at -29.1% and HDFC Life at -28.6%. The spread between the best and worst one-year performers was wide, spanning more than seventy percentage points. Such dispersion shows how differently individual constituents fared over the same twelve months.
Strongest and Weakest Over Twelve Months
The table below pairs the five strongest and five weakest one-year performers, with closing prices and day changes for context. Reading the two groups side by side highlights the range of outcomes within a single index over the same period.
Reading the Dispersion
The gap between BSE at +40.8% and ITC at -36.6% spans more than seventy percentage points over the same twelve months. This dispersion is a reminder that an index is a collection of individual outcomes, not a single uniform path. Two constituents can share a year yet travel in opposite directions.
Several of the weakest one-year names actually rose on the day, including Tata Motors Passenger Vehicles at +2.64%, Jio Financial Services at +4.28% and HDFC Bank at +1.04%. A single strong session does little to change a twelve-month figure, which is why the two windows are shown separately. The contrast illustrates how short and long horizons can diverge.
How to Read These Numbers
Each measure in this wrap answers a different question, and reading them together gives a fuller picture than any single figure alone. Breadth asks how many stocks moved and in which direction. The median asks what the typical stock did. Volume asks how actively a name changed hands relative to its own recent norm.
Proximity to a 52-week high asks where the latest close sits within the past year's range. One-year performance asks how far a stock has travelled over twelve months. None of these measures predicts what happens next; each describes a facet of past prices at the close on 2 November 2026.
A Quick Reference to the Measures
The table below summarises the key measures used in this wrap and what each one records. It serves as a plain-language glossary for readers encountering these terms for the first time.
Putting the Session Together
Taken as a whole, the 2 November 2026 session showed broad participation, a positive median, one dominant volume-backed gainer and a small cluster of modest decliners. Three names sat near annual highs and none near annual lows, while the one-year spread remained wide. These are the recorded facts of the close, presented for clarity and education.
Readers can use these figures to understand how breadth, volume and range measures describe a single trading day. The numbers are observations of what happened, not signals of what comes next. Each measure is best read alongside the others rather than in isolation.
Disclaimer: This article is for general information and education only. It describes what historical prices and technical indicators showed on the date mentioned and does not predict future movements. It is not investment advice, a recommendation, or an offer to buy or sell any security.
Indicators are calculated from past data and can mislead, and all investments carry risk. Please consult a SEBI-registered investment adviser before making any financial decision.
From our network :
- The Final Descent: How ESA Retired the Legendary Cluster Constellation After 24 Years of Space Weather ScienceAfter 24 years mapping Earth’s magnetosphere, ESA’s Cluster mission concluded with a precisely controlled reentry over the South Pacific. This analysis explores the scientific legacy, engineering decisions, and debris mitigation principles behind one of space exploration’s most responsible retirements.
- Committed Mediterranean Precipitation Decline: Why Emissions Cuts Alone Cannot Restore Winter RainsNew NOAA research reveals that Mediterranean winter rains may decline irreversibly even with emissions cuts. Explore the science of committed climate change and regional impacts.
- University Language Proficiency Exams: Why Institutional Tests Demand Different Preparation Than IELTS and TOEFLDiscover why university-specific language proficiency examinations differ fundamentally from IELTS and TOEFL, and learn strategic preparation approaches for institutional assessment success.
- How AI Agents Will Change the Way We Manage Personal FinancesExplore how AI agents are transforming personal finance through automated budgeting, bill payment, and investment management, while examining the critical security protocols and governance frameworks required for safe deployment.
- CISA’s Ten-Advisory Wave: Why Generic Patching Fails in OT and How to Build Product-Specific PlaybooksCISA released ten ICS advisories in one week, exposing critical infrastructure risks. Generic patching fails in OT. Learn to build product-specific remediation playbooks.
- Live Online English Classes for Kids: Do They Actually Reduce Anxiety?A ten-week study reveals that synchronous online English classes can significantly reduce child language anxiety while improving listening and reading skills. Discover what makes these programs effective and how parents can select the right one.
- Mobile Learning and VR in English: What Global Evidence Reveals About Effective Language TechnologyA systematic review across 14 countries reveals which language-learning technologies genuinely work. Mobile learning, AI, and VR show measurable benefits when pedagogically integrated. This evidence-based guide helps educators and learners select technology that delivers real return on investment.
- Forbidden Matrix Patterns and Visible Lattice Points: A Geometric DictionaryExplore how multidimensional 0–1 matrices encode geometric truths, linking forbidden patterns to visible lattice points and hypergraph theory, with applications in combinatorics and computational geometry.
- The Hidden Cost of AI Convenience: Why Over-Permissioned Agents Are a Security Time BombDiscover why AI agents with excessive permissions create dangerous single points of failure, and learn how implementing least privilege principles can protect your organization from exploitation.
RESOURCES
- Sensex, Nifty Fall As IT Stocks Trigger Market Selloff - Kotak Neokotakneo.comJun 19, 2026 ... Market Wrap, 19 June 2026: Sensex And Nifty End In Red. Posted: 19 ... Pre-Market, 2 November 2026: Sensex And…
- Morning Wrap: ASX 200 futures flat, Nasdaq suffers its worst day ...marketindex.com.au18 hours ago ... +1.46%. Nifty 50. 74,460. +0.42%. Nikkei 225. 63,290. -2.12%. FTSE 100. 10,730. +0.07% ... Copyright © 2026 Market Index.
- PCS - LinkedInin.linkedin.comMarket Close | 2 Nov 2026 Reliance surged 11.6% to lift the benchmarks, with metals and energy also in demand. Nifty 50 ... Nifty50…
- World market update 2 November 2026 - Facebookfacebook.com17 hours ago ... World market update 2 November 2026. Summarized by AI from the ... Indian stock market update 26 October 2026 Nifty…
- Markets Today on X: "Indian Stock Market Closing Wrap, November ...x.com... ₹478.39 lakh crore. #IndianStockMarket #Sensex #Nifty50 #RelianceIndustries #StockMarketUpdate #NSE #BSE #Q2FY27 · 12:16 PM · Nov 2, 2026·. 297. Views ...
- Sensex, Nifty End Lower as Oil, Inflation and Fed Rate Fears Weightheindianawaaz.comMarket Wrap Sep 11: Sensex, Nifty End Lower as Oil, Inflation and Fed Rate ... 2 November 2026 1:27 PM INDIAN AWAAZ No Comments…
- Nifty 50 Stock Market wrap in 2 minutes - 16th Nov 2021 - Spotifyopen.spotify.comThis is for Information and knowledge only. See all episodes. More episodes like this. NGX Daily Market Summary Thursday October 28, 2026. Company. About…
- Kalkine - Indian Stock Market Insights | Nifty 50, Sensex & NSEkalkine.co.inDaily Wrap Nov 02, 2026 ...
- Indian Stock Market Today - Vittarthi Financial Calculatorsvittarthi.comLive Indian stock market updates for 02 Nov 2026. Track Nifty 50, Sensex ... Monday, 2 November 2026 · Last updated: 2 Nov, 09:31…
- Asia Market Wrap 5 October: Every Open Board Rises as Taipei ...edgeconsultancykw.comOct 5, 2026 ... ... Nifty 50 is against Thursday 1 October across Friday's Indian market holiday. ... Wrap of 2 October 2026, on…
- CNBC-TV18 - YouTubeyoutube.comStock Market LIVE Updates: Nifty & Sensex Live | US Elections | Crude Price | Nov 2nd | Trump ... market updates, Sensex, Nifty…
- Market wrap, Nov 2: SENSEX zooms 1,233 pts, NIFTY50 ends at ...upstox.comLast week, foreign investors infused around ₹6,300 crore into the equity market, while the cumulative FPI outflows from Indian equities in 2026 have reached…
- 2026 Market Outlook | J.P. Morgan Global Researchjpmorgan.com2026 market outlook: A multidimensional polarization. December 09, 2025 ... 2026 global economic outlook. 1 / 2. What's the overall outlook for global markets ...
- Latest Stock Market News, Financial Insights & Market Trends - Upstoxupstox.comstock-market-wrap-sensex-nifty50-Nov-2. LTCG tax on switching mutual funds ... ONGC, oil stocks, Nov 2, 2026. Personal Finance News. Tax · Latest Updates.
- Equity market data - London Stock Exchangelondonstockexchange.comMarket closed - opens at 08:00 on 2 November 2026. Equity market data. Market ... Airtel Africa Plc ORD USD0.50. GBX. 9,937.64. AALLink. Anglo…
- 01
- 02
- 03
- 04
- 05
- 06
- 07
- 08
0 Comments