When early midterm returns flashed Democratic gains on a Wednesday session, two of the world's most watched price signals moved in tandem: equities slid and the dollar softened against its major counterparts. That synchronized reaction is rarely accidental. It reflects how quickly institutional desks translate political probability into portfolio positioning, repricing the fiscal, regulatory and trade assumptions embedded in every asset they hold. Markets do not wait for certified results; they trade the direction of travel the moment partial counts hint at a shift in legislative balance.
The episode captures a durable truth about election-season investing. Currency and equity markets function as real-time referenda on policy continuity, and a divided or reconfigured Congress alters the calculus for taxes, spending, sector subsidies and debt issuance. A weaker dollar alongside falling stocks suggests investors were trimming exposure to American assets rather than fleeing to safety, a pattern that speaks to uncertainty about fiscal direction rather than outright panic. Understanding that distinction separates informed observers from headline readers.
This analysis unpacks the mechanics behind that dual move, tracing how political outcomes transmit through expectations, interest rate differentials and sector rotation. It examines why midterm surprises matter even when the Senate or House remains contested, how traders hedge political risk, and what the historical record says about post-election market behavior. The goal is a working framework for interpreting election-driven volatility with discipline rather than reflex.
On This Page
- Why Political Probability Moves Markets Before Results Are Final
- The Dollar's Reaction: Rate Differentials and Safe-Haven Logic
- Equity Repricing: Sector Rotation and the Discount Rate Effect
- Historical Patterns: What Post-Election Markets Usually Do
- Policy Uncertainty, Fiscal Risk and the Term Premium
- Investor Playbook: Discipline Over Prediction
TL;DR Early U.S. midterm results pointing to Democratic gains triggered a simultaneous stock selloff and dollar decline, as investors reassessed fiscal, regulatory and trade assumptions. The reaction illustrates how markets price political probability in real time, favoring defensive positioning and non-dollar assets when legislative control becomes uncertain. This analysis explains the transmission channels from ballot box to balance sheet, the role of rate differentials in currency moves, sector-level winners and losers, and the historical patterns that should guide disciplined interpretation of election-night volatility rather than reactive trading.
Why Political Probability Moves Markets Before Results Are Final
Financial markets are forward-looking discounting machines, and nothing forces them to discount faster than an unfolding vote count. When early midterm returns suggested Democratic gains, traders immediately began revising the probability distribution over future policy: corporate tax treatment, healthcare subsidies, energy regulation and infrastructure spending all sit downstream of legislative control. Each revision nudges expected cash flows and discount rates, and those nudges aggregate into index-level moves within minutes. The dollar's simultaneous weakness confirms that the repricing was not purely domestic; it reflected a reassessment of relative growth and rate expectations across borders.
The critical insight is that markets trade the second derivative of political change, not the level. A Democratic gain that merely narrows a majority matters differently from one that flips a chamber, and a divided government that blocks legislation can be read as stability by some desks and paralysis by others. This ambiguity is precisely what generates volatility: when the policy path forks, option-implied uncertainty rises, risk premia widen, and positioning becomes defensive until the distribution collapses toward a single outcome.
The Transmission Channels from Ballot Box to Balance Sheet
Political outcomes reach asset prices through several identifiable channels. The fiscal channel governs expected deficits and Treasury supply, which feed directly into yields and the currency. The regulatory channel shapes sector profitability, particularly for energy, healthcare and financial firms. The trade channel influences multinational earnings and cross-border capital flows. When early results hint at a policy shift, all three channels activate simultaneously, and the resulting price action is the net sum of their competing pressures rather than a clean verdict on any single one.
Currency markets add a fourth channel: relative monetary expectations. A weaker dollar against major peers implies investors are marking down the expected path of U.S. rates or demanding a larger premium to hold dollar assets. That can happen even without any change in Federal Reserve posture, simply because fiscal uncertainty alters the term premium. Watching the dollar alongside equities therefore provides a richer signal than either alone, distinguishing a growth scare from a policy-confidence shock.
Reading Early Returns Without Overreacting
Early counts are noisy, geographically skewed and frequently unrepresentative of final outcomes. Mail-in ballots, urban-rural reporting lags and district-level composition all distort the first hours of data. Professional desks know this and typically size initial positions modestly, using options and short-dated futures rather than large directional bets. Retail observers who treat the first headline as definitive often buy or sell into precisely the liquidity that professionals are using to hedge, which is why election-night volatility frequently reverses once fuller counts arrive.
Discipline therefore demands a probability-weighted approach. Assign rough likelihoods to plausible outcomes, estimate the market impact of each, and compare the resulting expected move against current pricing. If the market has already discounted a divided Congress, a confirmed divided Congress produces relief rather than decline. The surprise, not the outcome itself, drives returns, and early results only matter insofar as they shift the market's implied probabilities away from consensus.
The Dollar's Reaction: Rate Differentials and Safe-Haven Logic
A weakening dollar during a U.S. equity selloff is analytically interesting because it inverts the usual crisis pattern. In genuine risk-off episodes, capital typically flows toward dollar assets, strengthening the currency even as stocks fall. When both decline together, the market is signaling something more specific: diminished confidence in U.S. policy direction rather than fear of global collapse. Investors are not hiding in dollars; they are diversifying away from them, which points to a repricing of relative expected returns rather than a flight to safety.
Interest rate differentials anchor currency moves over medium horizons. If early election results raise the probability of fiscal expansion financed by heavier issuance, or of policy gridlock that delays growth-supportive spending, the expected path of real rates shifts relative to trading partners. A narrower differential erodes the carry advantage of holding dollars and encourages rotation into currencies with improving relative prospects. The dollar's decline on the day was therefore a rational response to revised expectations, not an emotional one.
Carry, Positioning and the Mechanics of a Softer Dollar
Currency markets are deeply reflexive, and positioning amplifies fundamental moves. When polls and early counts shift, leveraged accounts that had crowded into long-dollar carry trades face mark-to-market losses and unwind. That unwinding is self-reinforcing: selling begets selling until new buyers emerge at levels that compensate for the added political uncertainty. The result is often an overshoot relative to any reasonable estimate of fair value, which is why currency moves around elections tend to mean-revert once the policy picture clarifies.
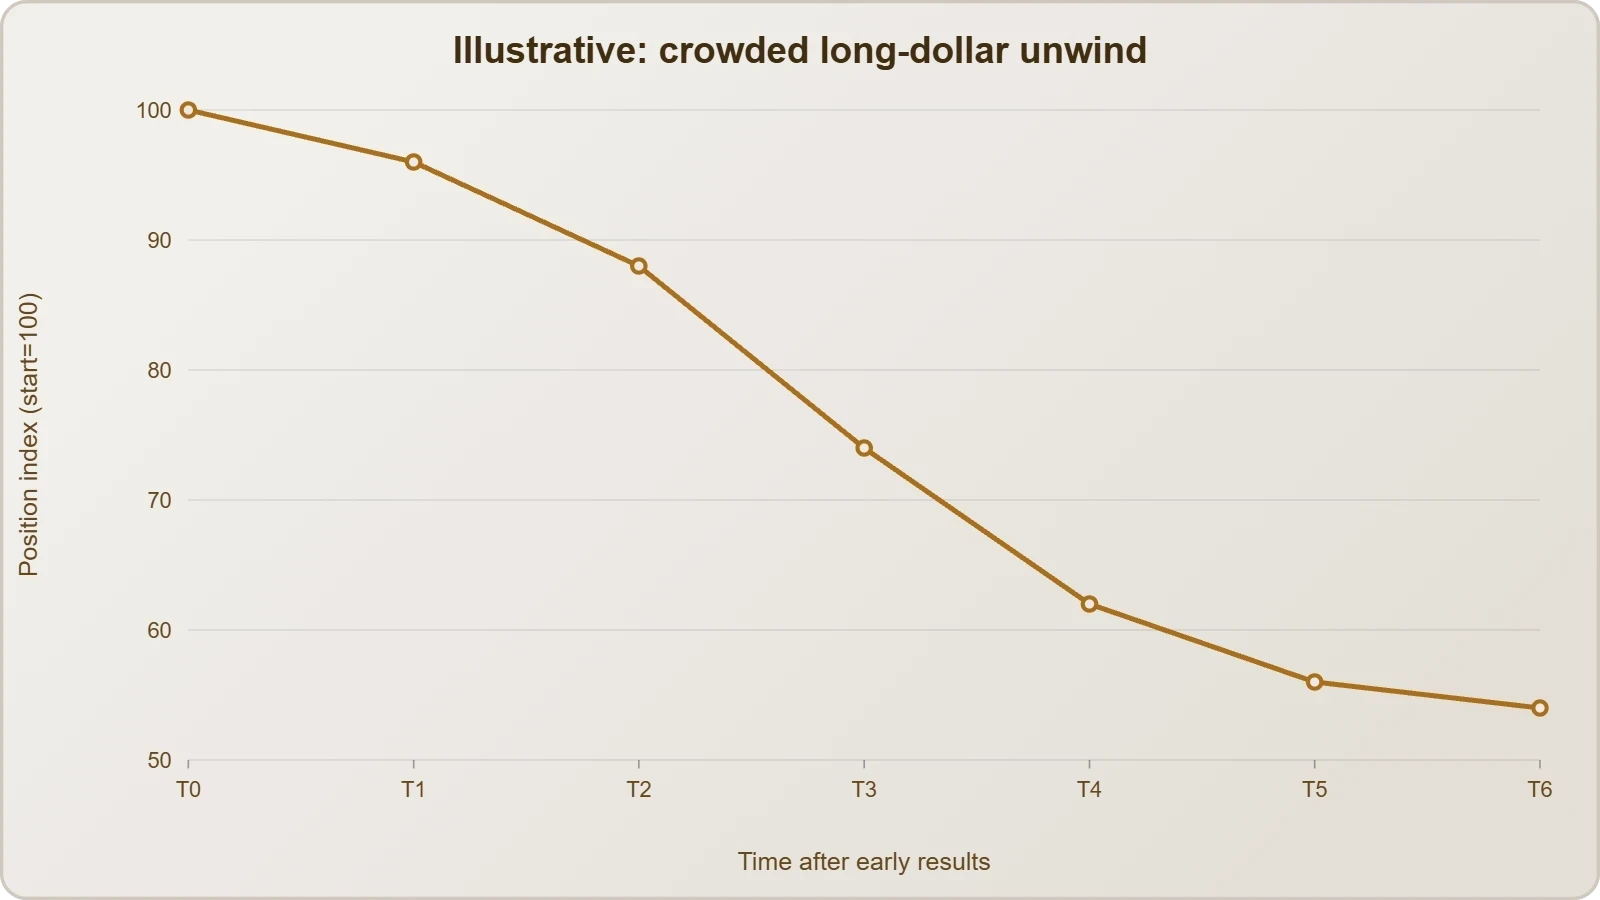
For corporate treasurers and global investors, the practical implication is straightforward. Hedging ratios deserve review before major political events, not after. A modestly weaker dollar benefits U.S. exporters and emerging-market borrowers with dollar liabilities, while pressuring importers and dollar-based return targets. Recognizing these second-order effects early allows portfolios to be positioned for the currency channel rather than surprised by it.
When Safe-Haven Status Is Tested
The dollar's safe-haven premium rests on institutional credibility, deep liquidity and the rule of law, not merely on economic size. Political uncertainty that touches fiscal sustainability or institutional norms can erode that premium at the margin, even if no crisis materializes. A single session's decline proves little, but the pattern of stocks and the dollar falling together during a political shock is a useful diagnostic: it suggests markets are questioning policy competence rather than seeking shelter from exogenous danger.
Gold, Treasuries and the yen often serve as alternative beneficiaries in such moments. Watching whether those assets rally alongside a weaker dollar helps confirm the interpretation. If they do, the market is expressing a genuine preference shift; if they do not, the dollar move may simply reflect technical positioning. This triangulation is standard practice among macro desks and offers retail observers a disciplined way to read election-night cross-asset behavior.
We Also Published
Equity Repricing: Sector Rotation and the Discount Rate Effect
Equity indices fell because two inputs to valuation moved against them at once. Expected cash flows became less certain as the policy path forked, and the discount rate applied to those flows edged higher as political risk premia widened. The decline was not uniform, however. Sector-level dispersion typically accompanies election shocks, because different industries carry different regulatory exposures. Healthcare, energy and financials sit closest to legislative outcomes, while technology and consumer staples respond more to the macro backdrop than to specific policy details.
This dispersion is where active managers earn their fees during election season. A broad index decline can mask substantial rotation beneath the surface, with defensive sectors attracting flows while cyclicals and rate-sensitive growth names lag. Understanding which sectors are exposed to which policy levers allows investors to distinguish between a genuine market-wide de-risking and a targeted repricing that creates relative-value opportunities.
Mapping Policy Exposure Across Sectors
Healthcare profitability depends heavily on subsidy structures and drug pricing rules, making it acutely sensitive to legislative control. Energy faces divergent regulatory paths on permitting, emissions and subsidies. Financials respond to capital requirements and consumer protection regimes. Industrials and materials track infrastructure spending and trade policy. Each sector's beta to political probability is distinct, and professional desks maintain explicit mappings so they can rotate quickly when early results shift the odds.
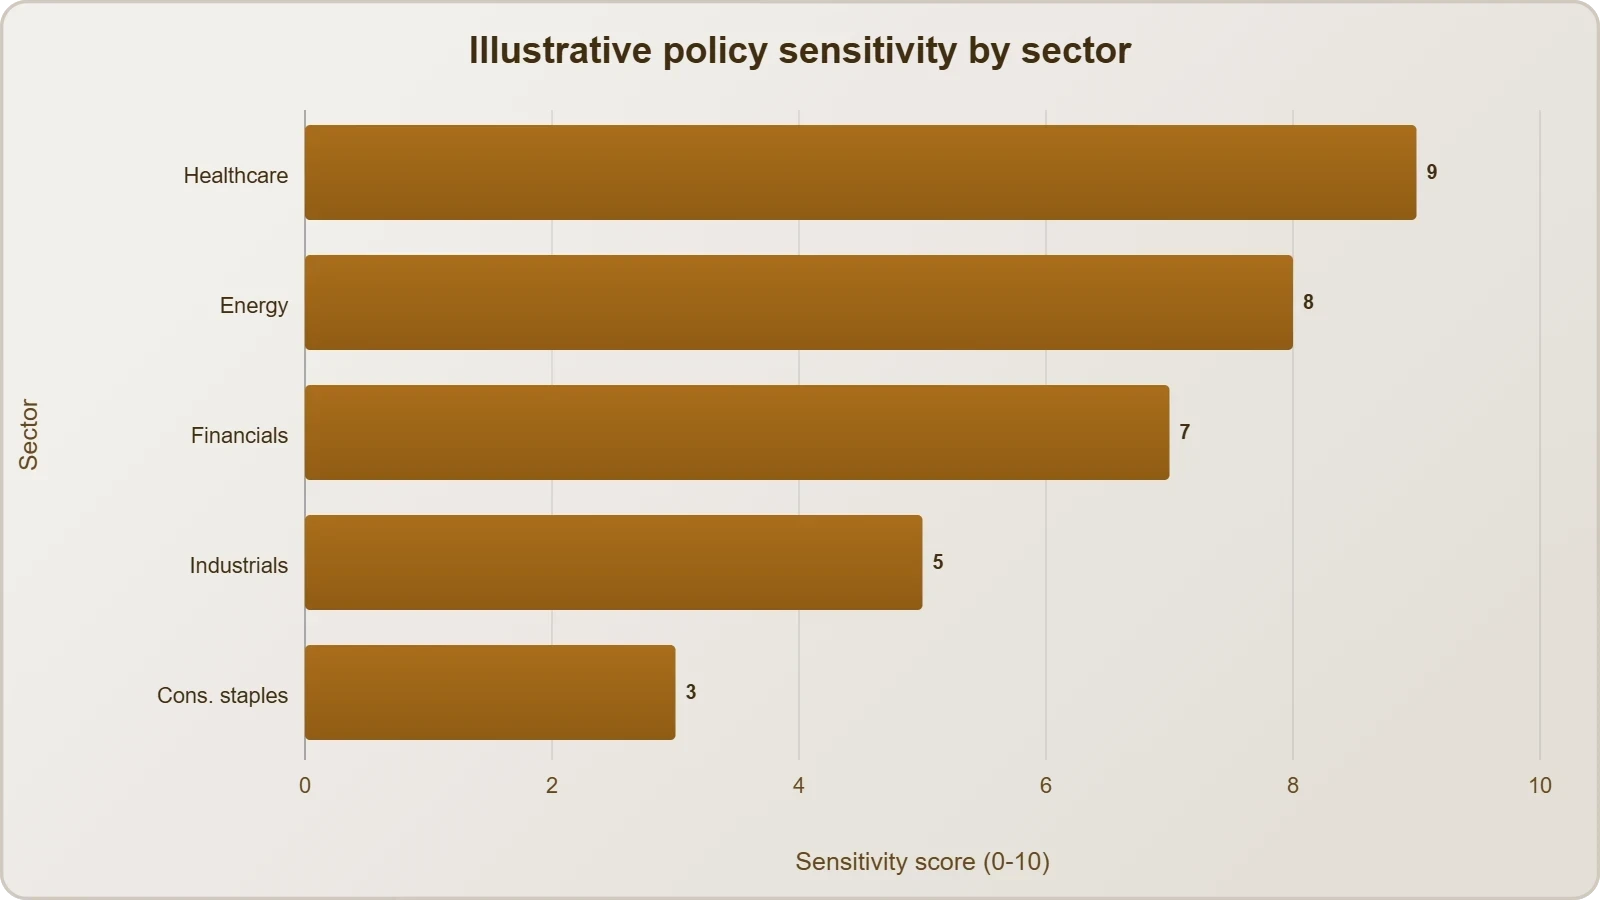
For long-horizon investors, the practical lesson is to avoid treating election outcomes as binary market calls. Policy change is slow, legislated through committees and subject to judicial review. The sectors most exposed to rhetoric are often least exposed to realized change, while second-order effects on suppliers, competitors and capital allocation can be more consequential than the headline regulation itself.
Volatility, Options and the Cost of Insurance
Implied volatility typically rises into elections and collapses afterward, a pattern known as the volatility crush. Options markets price political uncertainty explicitly, and the premium for protection around election dates can be substantial. Investors who buy insurance after results begin arriving often pay elevated prices for protection against risks that are already resolving, which is why professionals hedge before events rather than during them.
The relationship between realized and implied volatility offers a useful discipline. When implied volatility exceeds subsequent realized moves, sellers of insurance are compensated; when it underestimates them, hedgers are vindicated. Election nights frequently produce sharp but short-lived realized moves, rewarding those who sold volatility into the event and penalizing reactive buyers. Recognizing this asymmetry prevents costly timing errors.
- 01
- 02
- 03
- 04
Historical Patterns: What Post-Election Markets Usually Do
History offers a useful but frequently misread guide. Studies of U.S. election cycles show that equity markets tend to rally in the twelve months following midterms regardless of which party wins, largely because uncertainty resolves and the policy environment becomes predictable. The immediate reaction, however, is often negative when results diverge from expectations, and the dollar frequently softens during periods of divided government as fiscal clarity diminishes. These patterns are tendencies, not laws, and their reliability depends heavily on the starting valuation and macroeconomic backdrop.
The more robust finding is that volatility falls after elections. Uncertainty is priced continuously, and its resolution releases risk premia that had accumulated in the preceding months. Investors who position for this resolution rather than for a specific partisan outcome tend to fare better than those who forecast winners. The market's job is to price probabilities; the investor's job is to recognize when those probabilities are already reflected in prices.
Base Rates and Their Limits
Base rates provide a starting point, not a conclusion. The post-midterm rally pattern holds on average but masks wide dispersion, and the sample of modern midterms is small enough that confidence intervals are wide. Macro conditions dominate: a midterm occurring into a recession or a tightening cycle behaves very differently from one occurring into expansion. Treating historical averages as forecasts without conditioning on the current environment is a common and costly analytical error.
Currency patterns are similarly conditional. Dollar weakness around divided government reflects fiscal ambiguity, but it can be overwhelmed by relative monetary policy, global risk appetite or energy shocks. The disciplined approach is to use history to frame expectations and then update those expectations with current data, rather than to assume the past repeats mechanically.
Building a Framework for Election-Season Positioning
A workable framework begins with scenario mapping: define the plausible outcomes, assign probabilities, and estimate market impact for each. Compare the probability-weighted expected move against current pricing to identify where the market may be mispositioned. Then size positions according to conviction and liquidity, using options where the timing of resolution is uncertain. Finally, define exit criteria in advance, because election-driven moves often reverse quickly once counts finalize.
Risk management deserves particular emphasis. Political events generate gap risk that stop-losses cannot reliably contain, so position sizing must assume adverse overnight moves. Diversification across asset classes and geographies reduces single-event exposure. And patience is a genuine edge: the most reliable post-election trades often emerge days or weeks later, once the initial noise subsides and the policy path becomes legible.
Policy Uncertainty, Fiscal Risk and the Term Premium
Political uncertainty does not merely shift expectations; it changes the price of bearing risk. When the legislative path is unclear, investors demand compensation for holding long-duration government debt, and that compensation appears as a higher term premium. A rising term premium lifts yields across the curve, pressures equity valuations through the discount rate, and can weaken the currency if foreign investors require larger hedges. The simultaneous stock decline and dollar softening observed on the day is consistent with this mechanism operating in real time.
Fiscal sustainability concerns amplify the effect. If early results suggest either expanded spending or gridlock that blocks deficit reduction, the expected supply of government debt rises relative to demand. Markets price that through steeper curves and, at the margin, through currency depreciation. The magnitude depends on the starting debt trajectory and on whether the central bank is expected to accommodate, which is why identical political outcomes can produce very different market responses across cycles.
How Divided Government Is Priced
Divided government is often described as market-friendly because it constrains legislative change, but the reality is more nuanced. Gridlock reduces regulatory risk for incumbents while increasing fiscal drift, since neither party can implement consolidation. The net effect depends on which risk dominates at the time. In periods of high deficits, gridlock can be read as fiscal negligence and pressure bonds; in periods of aggressive regulatory proposals, it can be read as relief and support equities.
This duality explains why markets sometimes rally on divided outcomes and sometimes sell off. The key variable is the counterfactual: what policy path was priced before the vote. If unified control with aggressive change was the base case, gridlock is bullish. If fiscal consolidation was expected, gridlock is bearish. Early results that shift the probability of unified control therefore move markets in the direction of the revised counterfactual, not in a fixed partisan pattern.
Implications for Borrowers, Savers and Global Capital
Higher term premia raise borrowing costs for governments, corporations and households, with mortgages and long-dated corporate debt most exposed. Savers benefit from higher yields on cash and short-duration instruments, while long-duration bondholders face mark-to-market losses. Global capital flows respond to relative yields, so a rising U.S. term premium can attract foreign capital and support the dollar, partially offsetting the political-confidence effect. The net currency outcome depends on which force dominates.
For emerging markets, a softer dollar is generally supportive, easing dollar-denominated debt burdens and encouraging risk appetite. Commodities priced in dollars often firm. These second-order effects matter for diversified portfolios and explain why election outcomes in one country transmit rapidly across global asset classes, even when the direct policy link is tenuous.
Investor Playbook: Discipline Over Prediction
The most valuable takeaway from an election-night shock is procedural rather than predictive. Markets will always react to early results, and those reactions will sometimes be sharp, but the durable returns accrue to investors who maintain a framework through the noise. That framework begins with recognizing that political outcomes are probabilistic, that markets price probabilities continuously, and that the marginal information in any single headline is usually smaller than the price move it triggers.
Discipline also means respecting liquidity and time horizon. Short-term traders can exploit volatility but must manage gap risk and transaction costs. Long-term investors should treat election-driven drawdowns as opportunities to rebalance toward strategic targets rather than as signals to overhaul allocations. The political cycle is one input among many, and its influence on multi-decade returns is modest compared with earnings growth, innovation and valuation.
Practical Steps for the Days After an Election
First, separate confirmed outcomes from projections and note which market moves were driven by surprise versus confirmation. Second, review portfolio exposures to the sectors and currencies most sensitive to the revised policy path, and rebalance only where drift exceeds tolerance bands. Third, revisit hedging ratios for currency and rate exposure, since political uncertainty can persist for weeks. Fourth, avoid concentrated bets on a single interpretation of divided government, because the market's reading can shift as fiscal data arrive.
Finally, document the decisions and the reasoning behind them. A written record of what was expected, what occurred and why positions changed builds the kind of institutional memory that improves future judgment. Election cycles recur, and the investor who has thought carefully about transmission channels in advance will respond with calibration rather than reflex when the next early result flashes across the screen.
Common Pitfalls That Erode Returns
Overreacting to early counts is the most frequent error, followed by confusing partisan preference with market analysis. Another pitfall is ignoring second-order effects: a weaker dollar helps exporters but hurts importers, and a sector rotation can dominate index-level moves. Anchoring to historical averages without conditioning on current macro conditions is equally dangerous. Each of these errors stems from the same root cause, which is treating a probabilistic event as a deterministic signal.
The corrective is straightforward in principle and difficult in practice: define scenarios, assign probabilities, size positions modestly, and update as evidence accumulates. Markets reward preparation far more reliably than prediction, and election seasons are among the clearest tests of that principle. The investor who arrives with a framework will find the volatility manageable; the one who arrives with a forecast will find it disorienting.
From our network :
- Live Online English Classes for Kids: Do They Actually Reduce Anxiety?A ten-week study reveals that synchronous online English classes can significantly reduce child language anxiety while improving listening and reading skills. Discover what makes these programs effective and how parents can select the right one.
- Forbidden Matrix Patterns and Visible Lattice Points: A Geometric DictionaryExplore how multidimensional 0–1 matrices encode geometric truths, linking forbidden patterns to visible lattice points and hypergraph theory, with applications in combinatorics and computational geometry.
- Committed Mediterranean Precipitation Decline: Why Emissions Cuts Alone Cannot Restore Winter RainsNew NOAA research reveals that Mediterranean winter rains may decline irreversibly even with emissions cuts. Explore the science of committed climate change and regional impacts.
- Mobile Learning and VR in English: What Global Evidence Reveals About Effective Language TechnologyA systematic review across 14 countries reveals which language-learning technologies genuinely work. Mobile learning, AI, and VR show measurable benefits when pedagogically integrated. This evidence-based guide helps educators and learners select technology that delivers real return on investment.
- University Language Proficiency Exams: Why Institutional Tests Demand Different Preparation Than IELTS and TOEFLDiscover why university-specific language proficiency examinations differ fundamentally from IELTS and TOEFL, and learn strategic preparation approaches for institutional assessment success.
- CISA’s Ten-Advisory Wave: Why Generic Patching Fails in OT and How to Build Product-Specific PlaybooksCISA released ten ICS advisories in one week, exposing critical infrastructure risks. Generic patching fails in OT. Learn to build product-specific remediation playbooks.
- The Hidden Cost of AI Convenience: Why Over-Permissioned Agents Are a Security Time BombDiscover why AI agents with excessive permissions create dangerous single points of failure, and learn how implementing least privilege principles can protect your organization from exploitation.
- The Final Descent: How ESA Retired the Legendary Cluster Constellation After 24 Years of Space Weather ScienceAfter 24 years mapping Earth’s magnetosphere, ESA’s Cluster mission concluded with a precisely controlled reentry over the South Pacific. This analysis explores the scientific legacy, engineering decisions, and debris mitigation principles behind one of space exploration’s most responsible retirements.
- How AI Agents Will Change the Way We Manage Personal FinancesExplore how AI agents are transforming personal finance through automated budgeting, bill payment, and investment management, while examining the critical security protocols and governance frameworks required for safe deployment.
RESOURCES
- Resources will be updated soon.
- 01
- 02
- 03
- 04
- 05
- 06
- 07
- 08
0 Comments