When the first tranches of midterm election returns began to move across the wires on the evening of November 4, 2026, the reaction on Wall Street was neither panic nor celebration but something more instructive: a disciplined, almost clinical repricing of risk. US equity benchmarks slipped as investors absorbed early Democratic momentum, and the decline itself told a subtler story than any single headline could. Markets were not voting on candidates; they were voting on the probability distribution of future policy, regulation, fiscal spending, and tax treatment that those candidates might set in motion.
That distinction matters enormously for anyone trying to read the tape. Election-night selling is frequently a liquidity event rather than a verdict, driven by desks trimming exposure into an information vacuum while the composition of Congress remains unresolved. The full implications of a divided or shifting legislature take weeks, sometimes months, to price properly, and the initial move often reverses once the shape of the governing coalition becomes clear. What the market dislikes most is not a particular party but ambiguity itself, because ambiguity cannot be modeled, hedged, or discounted with confidence.
This analysis examines the mechanics beneath that single headline — how midterm outcomes transmit into equity valuations, which sectors carry the heaviest political beta, how historical post-election drawdowns have behaved, and what disciplined investors should monitor as results finalize. The goal is not to forecast the next session's close but to build a durable framework for interpreting political shocks through a financial lens, separating genuine structural change from the noise of a single turbulent trading day.
On This Page
TL;DR US equities declined as midterm election results began arriving, with early Democratic gains introducing fresh uncertainty about the legislative balance of power. The selloff reflects risk repricing rather than a verdict on policy, since the full implications of the outcome remain unresolved. Historically, election-driven drawdowns tend to be short-lived unless they coincide with genuine shifts in taxation, regulation, or fiscal direction. Investors should watch sector-level political exposure, the final composition of Congress, and the bond market's read on deficit trajectories rather than reacting to the first headline print.
The Anatomy of an Election-Night Selloff
Election-night equity moves are among the most misunderstood events in financial markets, because they occur in a window where information is arriving faster than it can be verified. Traders position defensively, volatility desks mark up option premiums, and algorithmic strategies respond to headline sentiment with mechanical speed. The result is a price discovery process that is genuinely informative about uncertainty but frequently misleading about fundamentals, since no one yet knows the final seat count, the committee leadership, or the realistic legislative agenda that will emerge from the ballot box.
Why Markets React Before They Understand
Financial markets are forward-discounting machines, and they price probability rather than certainty. When early returns suggest a shift in momentum, the marginal investor adjusts the odds assigned to competing policy scenarios, and that adjustment ripples through valuations immediately. A higher probability of gridlock, for instance, may reduce expected fiscal stimulus but also reduce expected regulatory tightening, producing offsetting effects that different sectors weight very differently. The aggregate index move therefore conceals a rich internal rotation beneath the surface.
This is why the same election result can be read as bullish by one desk and bearish by another without either being irrational. What appears as a simple decline in the headline index is often a complex reallocation of capital across sectors, styles, and market capitalizations. Understanding that internal structure is far more valuable to a long-term investor than the direction of the closing print, because it reveals which assumptions the market is actively revising and which it is holding steady.
The Liquidity Dimension Nobody Prices
Beyond sentiment, election nights impose a mechanical liquidity constraint. Market makers widen spreads, reduce inventory, and demand greater compensation for bearing overnight risk, which amplifies price moves relative to the underlying change in expectations. A modest shift in perceived policy probability can therefore produce an outsized index decline simply because the market's capacity to absorb selling has temporarily thinned. Recognizing this liquidity premium helps investors avoid over-interpreting moves that are structurally exaggerated.
Once the information vacuum closes and normal market depth returns, prices frequently retrace a meaningful portion of the initial move. This pattern is well documented across multiple election cycles and is one reason seasoned portfolio managers treat election-night volatility as an opportunity set rather than a signal. The discipline lies in distinguishing temporary liquidity-driven dislocation from genuine repricing of long-term cash flows, a distinction that requires patience and a clear analytical framework.
Political Beta: Which Sectors Carry the Weight
Not every equity sector responds equally to political news, and understanding this asymmetry is the foundation of any sensible election strategy. Healthcare, energy, financials, defense, and technology each carry distinct regulatory exposures that shift with the balance of legislative power. When early results suggest one party gaining momentum, capital rotates toward sectors whose earnings outlook improves under the implied policy mix and away from those facing heightened scrutiny, creating dispersion that index-level analysis entirely obscures.
Mapping Regulatory Exposure by Industry
Healthcare sits at the intersection of drug pricing policy, insurance regulation, and public spending, making it acutely sensitive to legislative control. Energy companies respond to permitting regimes, subsidy structures, and environmental enforcement, while financials watch capital requirements, consumer protection rules, and tax treatment of capital gains. Defense contractors track budget appropriations and geopolitical posture, and technology firms face antitrust scrutiny, data regulation, and immigration policy affecting talent pipelines. Each of these channels transmits political outcomes into discounted cash flows.
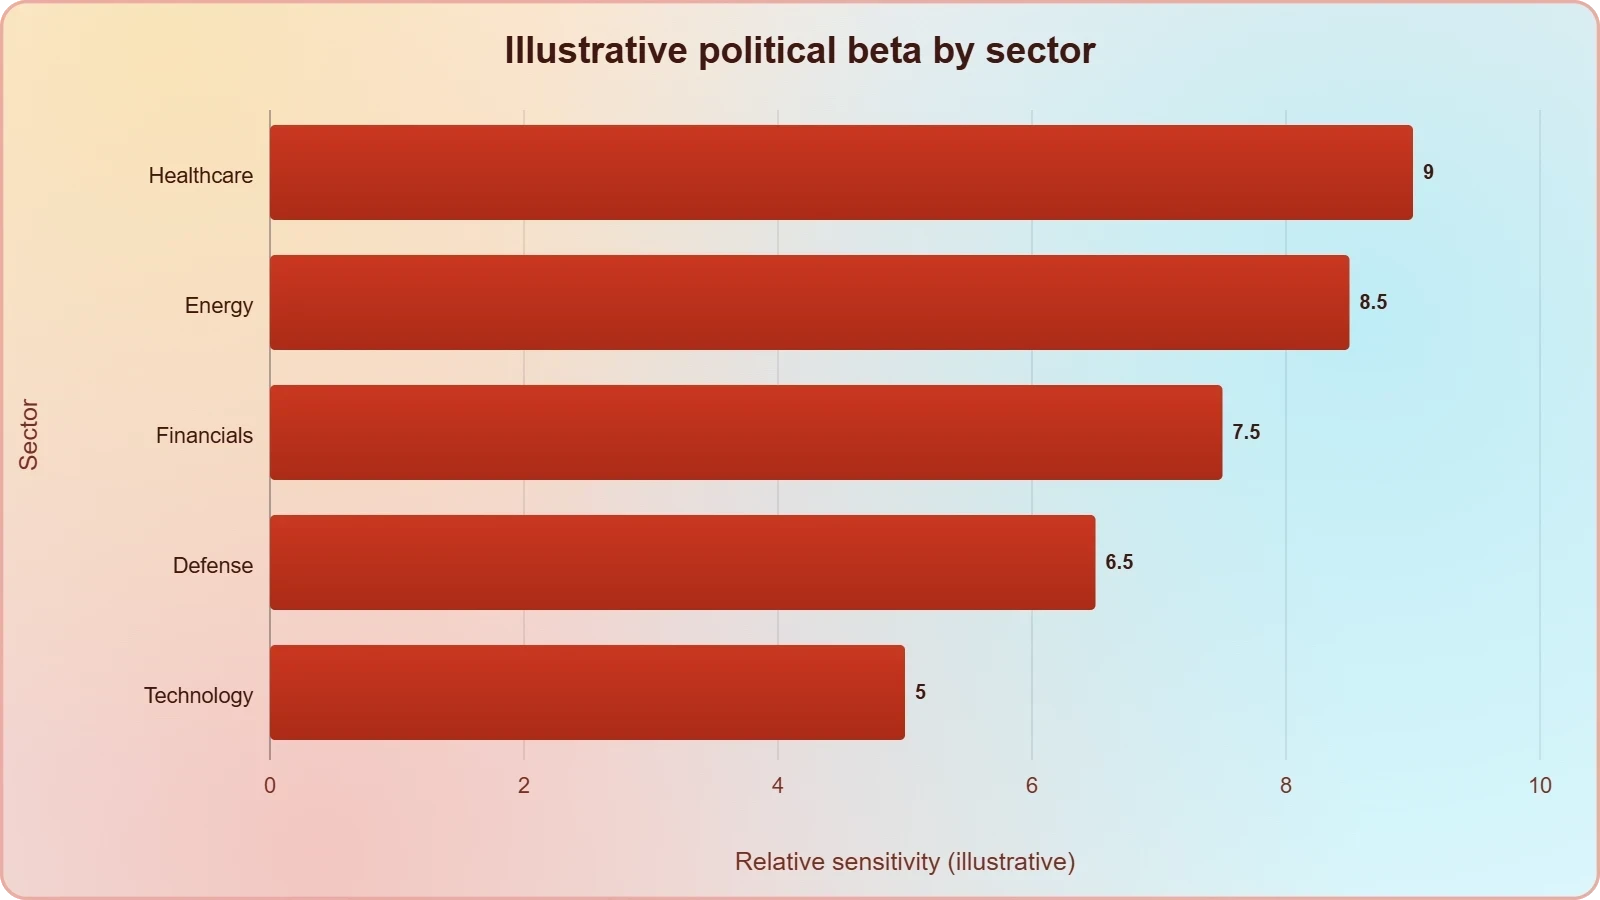
Investors who map these exposures explicitly can convert political noise into actionable relative-value insight. Rather than asking whether the market will rise or fall, they ask which earnings streams are most exposed to the specific policy levers likely to move. This reframing transforms an intimidating macro event into a structured set of sector-level questions, each with its own evidence base and its own timeline for resolution as the legislative picture clarifies over the weeks following the vote.
Historical Dispersion Around Midterms
Historical data on midterm cycles reveals a consistent pattern of elevated dispersion in the weeks surrounding the vote, followed by normalization as policy expectations settle. Sectors with the highest perceived political sensitivity tend to experience the widest swings, while defensive names with stable regulatory environments exhibit muted reactions. This dispersion is not random; it reflects the market's ongoing effort to price differential exposure to a policy environment whose contours are still being determined by the counting of ballots.
For portfolio construction, this argues for deliberate attention to correlation structures during election periods. Positions that appear diversified in calm markets can converge in their political exposure, producing concentrated risk precisely when volatility spikes. Prudent managers review sector weights, stress-test against plausible policy scenarios, and avoid letting headline-driven rotation dictate long-term allocation decisions that should rest on fundamentals rather than the evening's returns.
We Also Published
Reading the Bond Market's Verdict
Equity declines capture the headlines, but the bond market often delivers the more sophisticated verdict on election outcomes. Treasury yields encode expectations about fiscal deficits, inflation, and central bank reaction functions, and shifts in the yield curve frequently precede and explain equity sector rotation. When midterm results suggest divided government, the bond market may price reduced fiscal expansion, which can support duration even as cyclical equities weaken, producing cross-asset dynamics that a single-index view cannot capture.
Deficits, Duration, and Fiscal Credibility
The relationship between political outcomes and sovereign debt pricing rests on fiscal credibility. Markets assess whether the incoming legislature is likely to expand deficits through spending or tax cuts, and they adjust term premiums accordingly. A divided Congress that constrains fiscal ambition may be read as credit-positive for long-duration government bonds, while unified control that enables aggressive stimulus can steepen curves and pressure longer maturities. These signals matter for equity valuations because discount rates transmit fiscal expectations directly into present values.
Investors watching the 2026 midterms should therefore monitor the yield curve alongside equity indices, treating the two as complementary readings of the same underlying policy probability distribution. Divergence between equity and bond reactions often signals that one market is pricing a scenario the other has not yet absorbed, creating opportunities for disciplined cross-asset positioning. The bond market's relative sobriety frequently provides a useful corrective to equity market overreaction.
Currency and Global Spillovers
US elections are global events, and the dollar's reaction often reveals how international investors interpret the outcome. A perceived shift toward fiscal expansion or protectionist trade posture can move currency markets, which in turn affects multinational earnings, commodity prices, and emerging market capital flows. The 2026 midterm reaction therefore extends well beyond Wall Street, transmitting through trade channels and risk sentiment into economies with close ties to US demand and dollar funding conditions.
For globally diversified portfolios, this underscores the importance of monitoring cross-asset signals rather than isolating equity moves. A decline in US stocks accompanied by dollar strength and Treasury rally tells a different story than one accompanied by dollar weakness and curve steepening. Each combination implies a distinct policy narrative, and reading those narratives correctly is what separates informed allocation from reactive trading driven by the evening's headlines.
Historical Precedent: What Post-Election Drawdowns Teach
History offers a useful corrective to election-night anxiety, because the record of post-midterm equity performance is far more nuanced than the dramatic headlines suggest. Studies of prior cycles show that initial declines frequently reverse within weeks as uncertainty resolves, and that twelve-month returns following midterms have historically been positive more often than not. The caveat is that averages conceal enormous variation, and outcomes depend heavily on the economic backdrop and starting valuations rather than the election result alone.
Patterns Across Recent Cycles
Across recent midterm cycles, the recurring pattern has been volatility into the vote followed by relief as the outcome clarifies. Markets dislike unresolved contests, and once the composition of Congress is settled, investors can model the legislative agenda with greater confidence. The magnitude of the initial decline has varied widely, but the tendency toward stabilization and recovery has been remarkably consistent, particularly when the underlying economy remained resilient and corporate earnings continued to grow.
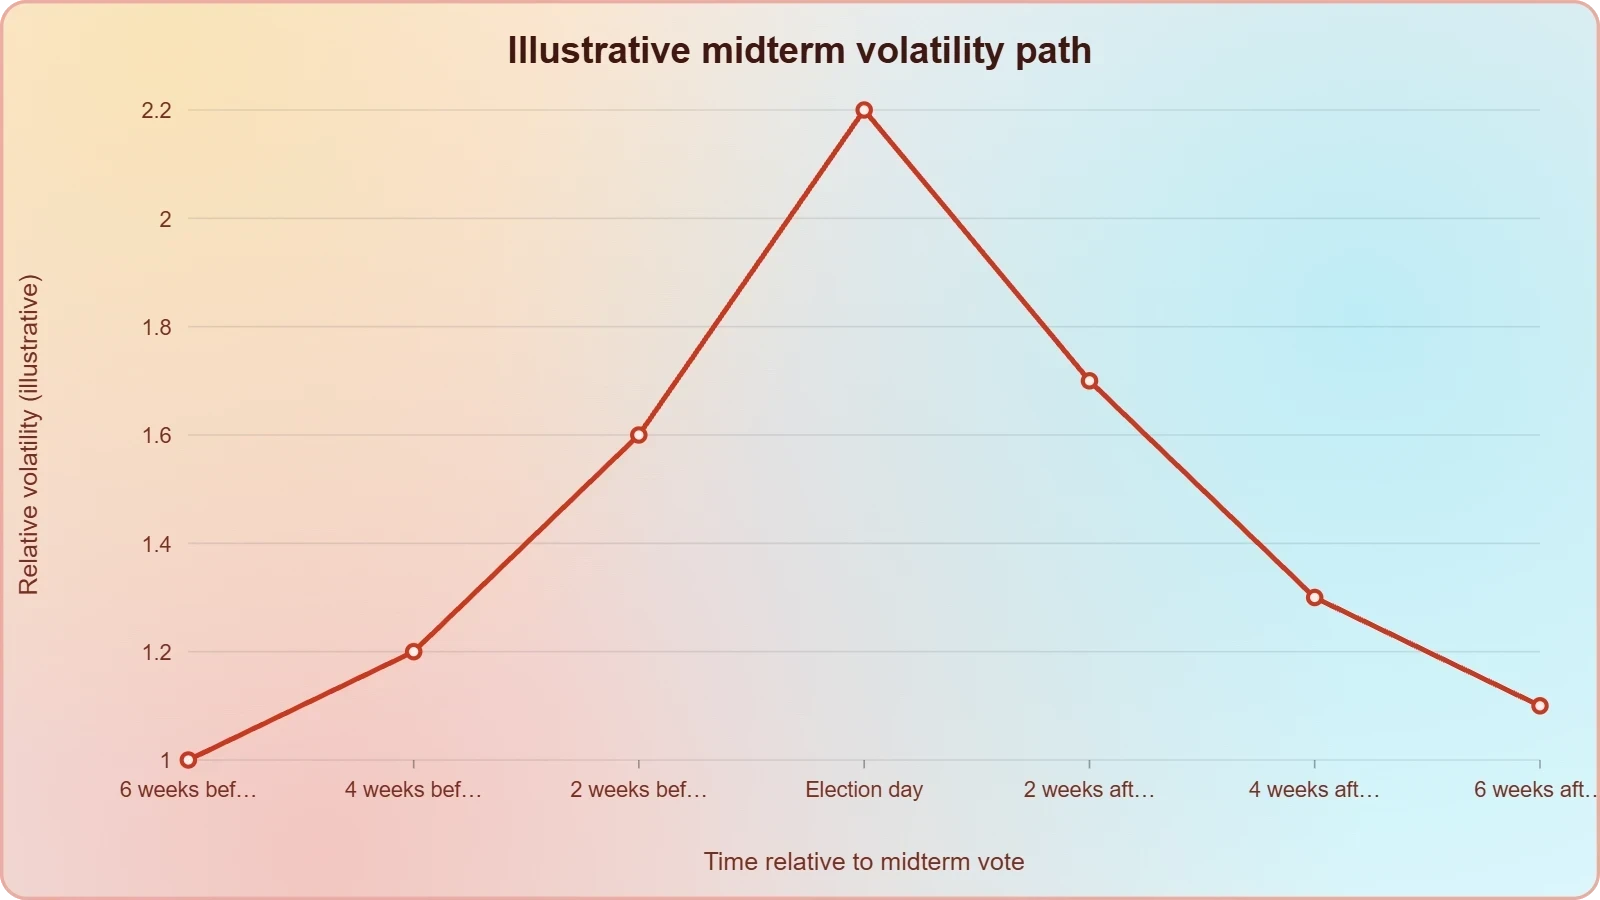
This does not mean elections are irrelevant; it means their impact is usually transitional rather than permanent. Structural policy changes, such as major tax legislation or healthcare reform, can have lasting valuation effects, but those emerge over months of legislative process rather than in a single evening. Investors who distinguish between transitional uncertainty and structural change avoid the common error of treating a temporary information gap as a permanent regime shift.
When Elections Actually Matter for Valuations
Elections matter most when they alter the trajectory of taxation, regulation, or fiscal spending in ways that change long-term cash flow expectations. A shift that credibly raises corporate tax rates, for example, directly reduces after-tax earnings and warrants a valuation adjustment. Conversely, deregulation that lowers compliance costs or expands addressable markets can lift valuations durably. The key test is whether the outcome changes the structural parameters of business economics, not merely the political complexion of the moment.
Applying that test to the 2026 midterms requires patience, because the legislative agenda will not be fully visible until committee leadership and priorities are established. Investors should therefore treat the initial selloff as a starting point for analysis rather than a conclusion, monitoring concrete policy developments and adjusting exposures as evidence accumulates. This evidence-based approach consistently outperforms reactive trading driven by the emotional intensity of election night.
Positioning Through Political Uncertainty
For investors, the practical question is not whether to fear or celebrate election results but how to construct portfolios that remain resilient across plausible political scenarios. That begins with recognizing that political risk is one input among many and should be integrated into a broader risk framework rather than treated as a standalone trading signal. Diversification across sectors, geographies, and asset classes remains the most reliable defense against the concentrated shocks that election nights can deliver.
Diversification as the First Defense
Diversification works precisely because political exposure is unevenly distributed. A portfolio weighted heavily toward sectors with high regulatory sensitivity carries concentrated political risk, while one spread across defensive and cyclical names, domestic and international exposures, and multiple asset classes is better insulated from any single policy surprise. The goal is not to eliminate political risk, which is impossible, but to ensure that no single legislative outcome can disproportionately damage the overall portfolio.
Beyond sector diversification, investors should consider time diversification as well. Election-driven volatility is typically concentrated in short windows, and long-horizon investors who avoid forced selling during those windows capture the recovery that historically follows. Maintaining adequate liquidity and avoiding excessive leverage are unglamorous but essential safeguards against being compelled to realize losses at precisely the wrong moment in the political cycle.
Monitoring the Signals That Matter
As results finalize, the signals worth monitoring are concrete and observable: the final seat composition of Congress, committee leadership assignments, the bond market's yield curve response, sector-level earnings revisions, and the dollar's trajectory. Each provides evidence about how the market is revising its policy expectations. Tracking these indicators systematically is far more productive than reacting to every headline, because it grounds decisions in verifiable developments rather than the emotional tempo of news coverage.
Discipline also means setting pre-defined thresholds for action. Rather than deciding in the heat of an election-night selloff, investors can specify in advance what evidence would justify rebalancing, which sectors warrant increased or reduced exposure under different legislative scenarios, and how much volatility they are prepared to tolerate. This pre-commitment reduces the influence of emotion and ensures that portfolio changes reflect analysis rather than the reflexive anxiety that election nights reliably produce.
The Core Message: Uncertainty Is the Asset Class
Beneath the specific mechanics of sector rotation, bond market signals, and historical precedent lies a simpler and more durable insight: what markets trade during elections is uncertainty itself. The decline in US stocks as midterm results arrived was not a judgment on any party's platform but a rational response to an unresolved probability distribution. Investors were pricing the cost of not knowing, and that cost is real, measurable, and temporary in ways that structural policy changes are not.
Understanding this distinction is the central lesson for anyone navigating political events in financial markets. Uncertainty resolves; policy endures. The volatility that accompanies an unresolved vote count fades as information accumulates, while the genuine consequences of legislation unfold over years. Investors who internalize this timeline avoid the twin errors of overreacting to election-night noise and underreacting to substantive policy shifts that emerge in the months that follow.
The 2026 midterms will ultimately be judged not by the direction of the stock market on the evening of November 4 but by the legislative record that follows. Markets will adapt, sectors will rotate, and valuations will adjust to whatever policy environment emerges. The disciplined investor's task is to remain analytical amid the noise, to distinguish transitional volatility from structural change, and to let evidence rather than emotion guide the allocation of capital through the political cycle.
From our network :
- The Final Descent: How ESA Retired the Legendary Cluster Constellation After 24 Years of Space Weather ScienceAfter 24 years mapping Earth’s magnetosphere, ESA’s Cluster mission concluded with a precisely controlled reentry over the South Pacific. This analysis explores the scientific legacy, engineering decisions, and debris mitigation principles behind one of space exploration’s most responsible retirements.
- Mobile Learning and VR in English: What Global Evidence Reveals About Effective Language TechnologyA systematic review across 14 countries reveals which language-learning technologies genuinely work. Mobile learning, AI, and VR show measurable benefits when pedagogically integrated. This evidence-based guide helps educators and learners select technology that delivers real return on investment.
- The Hidden Cost of AI Convenience: Why Over-Permissioned Agents Are a Security Time BombDiscover why AI agents with excessive permissions create dangerous single points of failure, and learn how implementing least privilege principles can protect your organization from exploitation.
- Committed Mediterranean Precipitation Decline: Why Emissions Cuts Alone Cannot Restore Winter RainsNew NOAA research reveals that Mediterranean winter rains may decline irreversibly even with emissions cuts. Explore the science of committed climate change and regional impacts.
- CISA’s Ten-Advisory Wave: Why Generic Patching Fails in OT and How to Build Product-Specific PlaybooksCISA released ten ICS advisories in one week, exposing critical infrastructure risks. Generic patching fails in OT. Learn to build product-specific remediation playbooks.
- Live Online English Classes for Kids: Do They Actually Reduce Anxiety?A ten-week study reveals that synchronous online English classes can significantly reduce child language anxiety while improving listening and reading skills. Discover what makes these programs effective and how parents can select the right one.
- How AI Agents Will Change the Way We Manage Personal FinancesExplore how AI agents are transforming personal finance through automated budgeting, bill payment, and investment management, while examining the critical security protocols and governance frameworks required for safe deployment.
- Forbidden Matrix Patterns and Visible Lattice Points: A Geometric DictionaryExplore how multidimensional 0–1 matrices encode geometric truths, linking forbidden patterns to visible lattice points and hypergraph theory, with applications in combinatorics and computational geometry.
- University Language Proficiency Exams: Why Institutional Tests Demand Different Preparation Than IELTS and TOEFLDiscover why university-specific language proficiency examinations differ fundamentally from IELTS and TOEFL, and learn strategic preparation approaches for institutional assessment success.
RESOURCES
- Midterm Elections and Stock Market Trends - BlackRockblackrock.comOct 1, 2026 ... Midterm election years have historically been among the weakest performing years for the U.S. stock ... markets react to the…
- How midterm elections affect the stock market | U.S. Bankusbank.com7 days ago ... Stock market performance after midterm elections has historically been stronger. U.S. stocks returned an average of 12.4% during the following ...
- Fearless US stock market vulnerable to shocks as midterms loomreuters.comSep 9, 2026 ... While analysts do not expect the elections themselves to prompt a big market reaction, the run-up to the November 3…
- Stock market after midterm elections: S&P 500 history - CNBCcnbc.com2 days ago ... U.S. Markets · Currencies · Prediction Markets · Cryptocurrency · Futures ... reaction day but was up 3.4% a month…
- How might midterm elections impact the stock market? | Fidelityfidelity.comMidterm election-year returns have ranged from drawdowns of 27% to gains of nearly 40%, underscoring that midterms themselves are typically not the primary ...
- Midterm elections could jolt stocks if Democrats sweep Congresscnbc.com17 hours ago ... The stock market is not yet pricing in a Democratic sweep of Congress — despite some polls and most prediction…
- U.S. Midterm Elections Stock Market Impact 2026 | Morgan Stanleymorganstanley.comJul 22, 2026 ... The executive branch remains the primary driver of policies that matter most to investors. Equity markets have generally shown limited…
- How has the US stock market performed around midterm elections?schroders.comNov 1, 2018 ... History tells us that markets have historically struggled to price in political risk at times like this, exemplified by the…
- 2026 midterms: How the election results could drive marketsameriprise.comSep 14, 2026 ... 2026 midterms: What a new Congress could mean for investors. As the 2026 U.S. midterm elections approach, Ameriprise Financial experts…
- Midterm mindset seeping into the U.S. stock marketrbcwealthmanagement.comSep 9, 2026 ... Voter concerns leading up to the election are wide-ranging. RBC Capital Markets equity analysts seem mostly unfazed by the election ...
- U.S. stock market pushes higher after midterm electionswashingtonpost.comNov 7, 2018 ... The Dow Jones industrials like a divided government — so far. The blue-chip index closed Wednesday up 545 points after…
- Analysis-Fearless US stock market vulnerable to shocks as ...ca.finance.yahoo.comSep 9, 2026 ... By Saqib Iqbal Ahmed NEW YORK, Sept 9 (Reuters) - With two months until the U.S. midterm elections, the options…
- How do markets perform post-midterms?am.jpmorgan.comOct 7, 2026 ... Discover how U.S. midterm elections impact equity markets, earnings growth and Federal Reserve policy. Explore expert insights on economic ...
- What the Midterm Elections Will Mean for Markets | Morningstarmorningstar.comOct 8, 2026 ... The United States midterm elections are less than a month away. ... Election years often bring bigger swings in the…
- What to expect from markets during a midterm election yearameriprise.comApr 1, 2026 ... Discover how U.S. stocks typically perform during midterm election years. Learn five historical trends and strategies to help you stay…
- 01
- 02
- 03
- 04
- 05
- 06
- 07
- 08
0 Comments