On a single trading session in early November 2026, the American equity market delivered a lesson in concentration that few investors will forget quickly. Nvidia and a narrow band of mega-cap technology names pushed the major indices into positive territory even as Apple and a long tail of ordinary stocks slid lower. The divergence was not subtle. Beneath a calm headline number sat a market where a handful of semiconductor and artificial-intelligence leaders carried the entire index on their shoulders while the median stock quietly lost ground. That gap between the index and the average company is the real story.
What makes this session instructive is how familiar the pattern has become. Index performance has increasingly decoupled from breadth, meaning the percentage of stocks advancing versus declining. When a trillion-dollar chipmaker rises sharply, its weight in a capitalization-weighted benchmark can overwhelm the drag from hundreds of smaller declines. Investors who glance only at the S&P 500 or Nasdaq print may conclude that risk appetite is healthy, when in fact the market is being held aloft by a shrinking group of winners. Understanding that mechanics matters far more than memorizing the day's closing figures.
This analysis unpacks the forces behind that split session, from AI-driven earnings expectations and oil-price sensitivity to the structural quirks of index construction. It examines why Apple's weakness did not sink the tape, how passive flows amplify mega-cap moves, and what the episode signals about fragility in a top-heavy market. The goal is not to predict tomorrow's close but to give readers a durable framework for reading days when the headline index and the underlying market tell two different stories.
On This Page
TL;DR A narrow rally led by Nvidia and other mega-cap technology stocks lifted US indices on a day when Apple and much of Wall Street declined, illustrating how extreme index concentration can mask broad weakness. Capitalization-weighted benchmarks reward the largest companies disproportionately, so a few AI-linked winners can offset hundreds of losers. This dynamic creates headline resilience but underlying fragility, and investors should watch market breadth, earnings concentration, and passive-flow mechanics rather than the index print alone.
The Anatomy of a Split Trading Session
A split session occurs when the headline index and the median stock move in opposite directions. On this particular day, the gains among a small cluster of large technology companies were sufficient to offset declines across much of the market, a phenomenon the Associated Press highlighted in its coverage. The mechanism is straightforward but often misunderstood: in a capitalization-weighted index, a company's influence is proportional to its market value, so the largest firms can single-handedly determine the direction of the aggregate even when most constituents fall.
Why Index Direction Can Mislead
Consider a simplified index of ten companies where one firm represents thirty percent of total weight. If that single giant rises five percent while the other nine each slip one percent, the index can still finish higher despite nine decliners. Real benchmarks behave the same way at far greater scale. This arithmetic explains why a session can feel bullish at the index level while most portfolios, which are typically more diversified than the benchmark, experience losses. The headline becomes a measure of the biggest companies, not the health of the broader market.
The practical implication is that investors must distinguish between index return and market return. Index return reflects weighted performance; market return, often proxied by equal-weighted indices or advance-decline lines, reflects the experience of the typical stock. When these two diverge persistently, it signals that leadership is narrow and that the rally depends on a fragile foundation. Historically, such narrowness has preceded periods of elevated volatility, though the timing of any correction remains genuinely unpredictable.
The Role of Earnings Expectations
Technology leadership in this cycle is tightly bound to artificial-intelligence earnings expectations. Nvidia and its peers have become the market's growth engine because investors believe their revenue trajectories justify premium valuations. When those expectations are reinforced, capital flows toward them aggressively, and their index weight grows further. Apple's decline on the same day illustrates that even the largest companies are not immune to company-specific pressures, whether from demand concerns, competitive dynamics, or valuation fatigue after extended runs.
The asymmetry matters. A modest disappointment in a mega-cap technology name can be offset by enthusiasm elsewhere in the same sector, but a broad-based decline across many sectors has no such counterweight. This is why earnings season concentrates so much market risk into a handful of reporting dates. The market is effectively pricing a future in which AI infrastructure spending continues to compound, and any evidence to the contrary would test the very pillar holding the index aloft.
Nvidia and the AI Trade as Market Ballast
Nvidia's role in this market extends well beyond its own shareholders. As the dominant supplier of the accelerators powering artificial-intelligence workloads, the company sits at the center of a capital-spending cycle that touches data centers, cloud providers, and semiconductor supply chains worldwide. When its shares rise, the effect ripples through suppliers, partners, and the broader technology sector. That gravitational pull is precisely why a single company's strength can lift an entire index on a day when most other names are struggling to find buyers.
The Concentration Feedback Loop
There is a self-reinforcing quality to mega-cap leadership. Rising share prices increase a company's index weight, which in turn increases the amount of capital that passive funds must allocate to it. That mechanical buying can push prices higher still, attracting momentum investors and further inflating the weight. The loop is not infinite, but while it persists it creates the appearance of broad market strength. Understanding this feedback is essential for anyone trying to interpret why the largest stocks seem to defy gravity while the rest of the market languishes.
Critics point out that this dynamic concentrates risk. If sentiment toward AI spending cools, the same weight that amplified gains would amplify losses. Supporters counter that the earnings power of these companies is real and growing, justifying their valuations. Both views contain truth, and the tension between them is what makes the current market so consequential. The prudent response is not to pick a side dogmatically but to size positions and diversify in ways that acknowledge the concentration risk embedded in any broad index exposure.
Apple's Decline and Company-Specific Risk
Apple's decline on the same day serves as a reminder that even the most valuable franchises face idiosyncratic pressure. Whether driven by demand signals, competitive threats, or simple profit-taking after a strong run, the stock's weakness demonstrated that not all mega-caps move in lockstep. This matters because it shows the rally is not a uniform tide lifting every large technology name; it is a selective rotation toward the companies most directly tied to the AI narrative. Investors who treat big tech as a monolith misread the market's internal logic.
The divergence also highlights the importance of fundamental analysis over index-level shortcuts. A portfolio that simply owns the largest companies by weight is implicitly making a concentrated bet on AI infrastructure. That bet may pay off, but it is a bet nonetheless, and it deserves to be understood as such. Recognizing the difference between passive diversification and passive concentration is one of the most valuable insights an investor can carry into a market shaped by a handful of dominant firms.
Reading Market Breadth and Internals
Market breadth measures how many stocks participate in a move, and it is among the most reliable tools for distinguishing genuine strength from narrow leadership. When an index rises but the advance-decline line falls, technicians view the divergence as a warning. The reasoning is intuitive: a healthy rally draws in buyers across sectors, while a fragile one depends on a few names. Breadth indicators do not predict timing, but they describe the quality of a move, and quality matters when the market's foundation rests on so few pillars.
Advance-Decline and Equal-Weight Signals
The advance-decline line accumulates the difference between advancing and declining stocks over time. When the index makes new highs but the line does not confirm, the divergence suggests participation is thinning. Equal-weighted indices offer a complementary lens, giving each company the same influence regardless of size. Comparing a cap-weighted benchmark to its equal-weighted counterpart reveals how much of the return comes from the giants. On split sessions like this one, the gap between the two widens, offering a clean quantitative read on concentration.
Investors can track these signals through widely available data, and the effort is modest relative to the insight gained. A simple habit of checking breadth alongside the headline index can prevent the common error of extrapolating a few winners' strength to the entire market. The discipline is especially valuable during earnings season, when company-specific news can swing individual names sharply and distort the aggregate picture. Breadth keeps the analyst honest about what is actually happening beneath the surface.
Volatility and Sector Rotation
Narrow leadership often coincides with complacency in volatility measures. When the index grinds higher on the strength of a few names, implied volatility can remain subdued even as the average stock experiences turbulence. This mismatch can persist for extended periods, but it leaves the market vulnerable to sharp reversals if the leaders stumble. Sector rotation, meanwhile, reveals where capital is flowing. On this day, money concentrated in semiconductors and AI-adjacent names while other sectors absorbed selling pressure, a pattern consistent with a market pricing a specific technological future.
For portfolio managers, the practical takeaway is to monitor rotation rather than react to every headline. A single session rarely defines a trend, but a series of sessions with the same narrow signature does. When leadership broadens, the market's foundation strengthens; when it narrows further, caution is warranted. The art lies in distinguishing a healthy consolidation from a deteriorating advance, and breadth data provides the clearest evidence for that judgment.
We Also Published
Macro Crosscurrents: Oil, Rates, and Policy
Equity markets do not move in isolation, and the same session that featured a tech-led rally was also shaped by oil prices, interest-rate expectations, and the broader policy backdrop. Energy costs influence inflation, which in turn shapes central-bank policy, which ultimately determines the discount rate applied to future corporate earnings. For high-growth technology companies whose valuations depend heavily on distant cash flows, even modest shifts in rate expectations can produce outsized price moves. The interplay between these forces explains why a single day can contain both euphoria and anxiety.
Oil Prices and Inflation Transmission
Oil occupies a peculiar place in the market's imagination. Rising crude prices can signal robust demand, which is good for energy producers but bad for consumers and transport-heavy businesses. Falling prices offer relief on input costs but may hint at slowing growth. On any given day, the market interprets oil through whichever lens dominates the narrative. For technology stocks, the transmission channel runs through inflation and rates: cheaper energy eases price pressure, supports easier policy, and flatters long-duration growth valuations.
The relationship is rarely linear, and investors who reduce it to a simple rule miss important nuance. What matters is the direction of travel and the market's interpretation of it. A modest oil move may be irrelevant; a sharp one can reprice entire sectors. In a market as concentrated as the current one, macro shocks can hit the leaders hardest precisely because so much capital is riding on their continued outperformance. Diversification across macro exposures remains a sensible defense against that asymmetry.
Rate Expectations and Growth Valuations
Interest rates are the gravitational force of asset valuation. When expectations for policy rates shift, the present value of future earnings changes, and growth stocks feel the effect most acutely because their cash flows are weighted toward the distant future. A market that is pricing an AI-driven earnings boom is also implicitly pricing a favorable rate environment. If rates rise unexpectedly, the arithmetic of discounted cash flow becomes less forgiving, and the premium valuations of the leaders come under scrutiny.
This is why central-bank communication commands such intense attention. Every hint about the path of policy is parsed for its implications for the discount rate. The market's narrow leadership amplifies the stakes: if the few companies carrying the index are also the most rate-sensitive, then a policy surprise could produce a disproportionate drawdown. Investors should treat rate risk as a structural feature of the current market rather than a distant abstraction, and position accordingly.
- 01
- 02
- 03
- 04
Index Construction and the Passive Flow Effect
The modern market is shaped as much by plumbing as by fundamentals. Passive investment vehicles now hold a substantial share of US equities, and their flows are dictated by index weights rather than by valuation judgments. When a mega-cap stock rises, its weight increases, and passive funds must buy more of it to track the benchmark. This mechanical demand is indifferent to price and can reinforce momentum. Understanding this plumbing is essential to interpreting why the largest stocks can outperform for extended periods even when their fundamentals are fully reflected in price.
Capitalization Weighting Mechanics
Capitalization weighting assigns influence in proportion to market value. The formula is simple: a company's weight equals its market capitalization divided by the total capitalization of all constituents. Mathematically, ##w_i = \frac{C_i}{\sum_{j} C_j}##, where ##C_i## represents the market capitalization of company ##i##. This elegant design has a profound consequence: the largest companies dominate index returns, and their movements can overwhelm the collective performance of hundreds of smaller firms. The structure is efficient for tracking the market's aggregate value but poor at representing the typical company's experience.
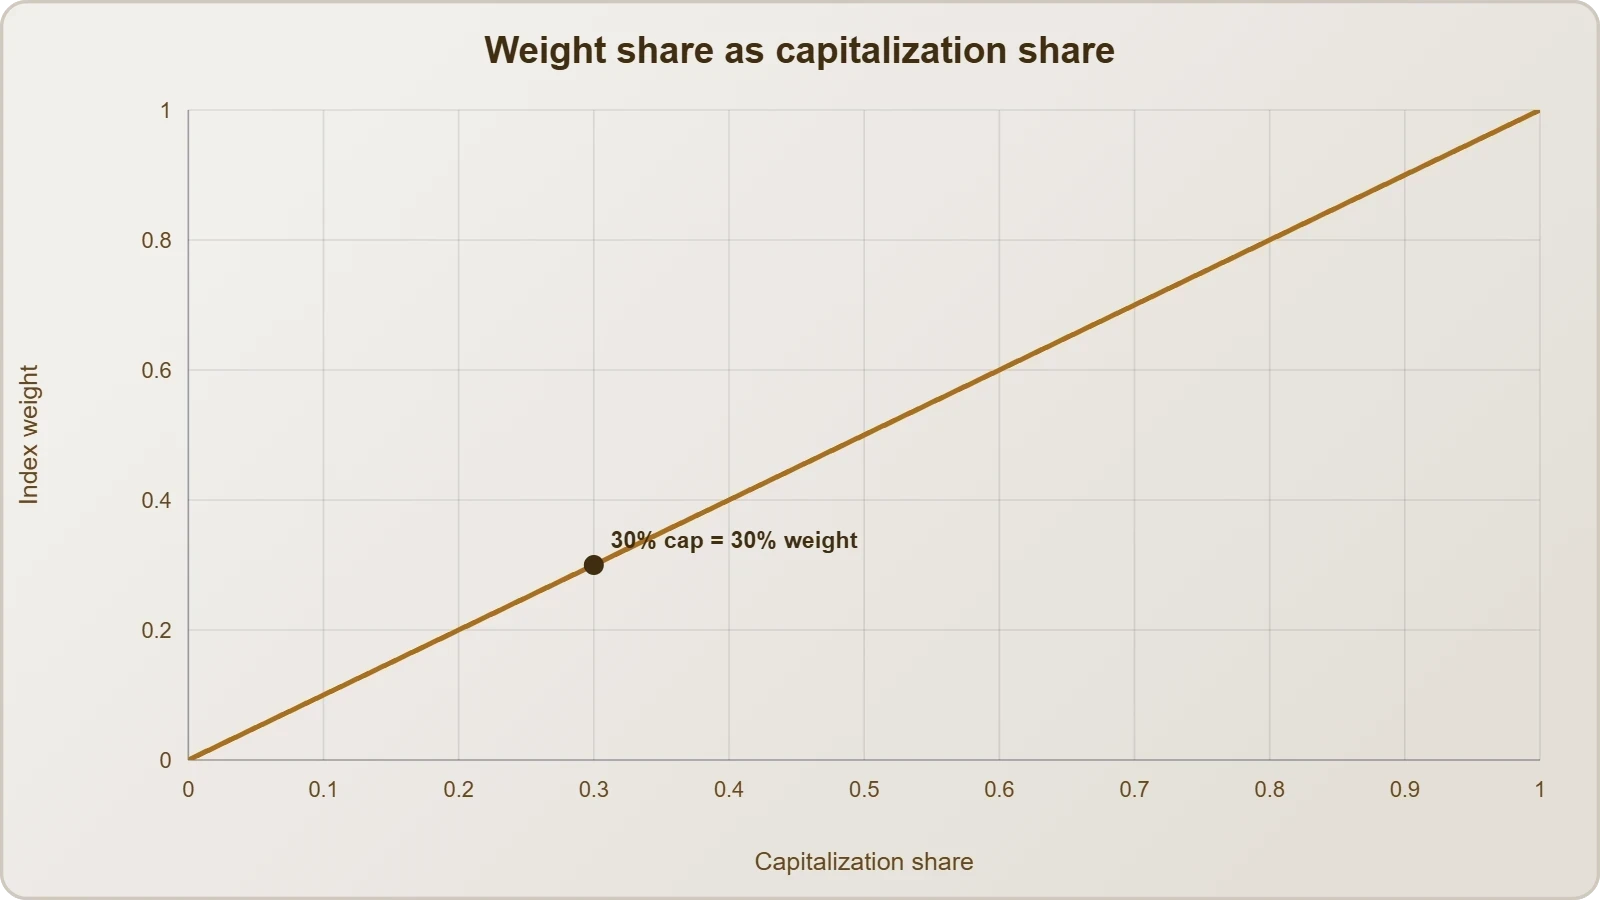
Alternative weighting schemes exist, including equal weighting, fundamental weighting, and factor-based approaches. Each addresses the concentration problem differently, and each carries its own trade-offs. Equal weighting forces regular rebalancing and can improve breadth representation, but it also introduces turnover costs and a small-cap tilt. Fundamental weighting avoids price-driven distortions but requires judgment about which metrics to use. No scheme is universally superior; the choice depends on the investor's objectives and tolerance for tracking error.
Flows, Rebalancing, and Momentum
Passive flows create a subtle momentum effect. As index funds receive contributions, they allocate proportionally, directing the most capital to the largest names. This steady demand can support prices and attract further flows, a feedback loop that reinforces leadership. Rebalancing events add another layer: when indices adjust weights, funds must trade, and those trades can move prices in predictable directions. The aggregate effect is a market where mechanical forces coexist with fundamental analysis, sometimes amplifying it and sometimes overriding it.
Critics argue that this dynamic undermines price discovery, allowing valuations to drift from fundamentals. Defenders counter that active managers still set marginal prices and that passive flows simply reflect investor preferences. The truth likely lies in between. What is clear is that investors should understand the vehicles they own and the mechanical forces acting on their holdings. A passive fund is not a neutral window on the market; it is a concentrated bet on the largest companies, and that bet deserves conscious acknowledgment.
Risk Management in a Top-Heavy Market
For investors, the practical question is how to manage risk when the market's fate rests on a handful of companies. The answer begins with honest measurement. A portfolio that appears diversified by number of holdings may be concentrated by weight, with a few positions driving most of the variance. Calculating the effective number of bets, or the contribution of the top holdings to overall risk, reveals the true concentration. Many investors discover that their diversified fund is, in practice, a leveraged bet on the largest technology companies.
Measuring Concentration Risk
Concentration can be quantified using tools such as the Herfindahl-Hirschman Index, which sums the squares of portfolio weights. Mathematically, ##HHI = \sum_{i} w_i^2##, where ##w_i## is the weight of each holding. A portfolio of equal weights across many names produces a low index, while one dominated by a few large positions produces a high value. The reciprocal of the HHI approximates the effective number of equally weighted holdings, offering an intuitive measure of true diversification that simple holding counts obscure.
Beyond statistical measures, investors should examine sector and factor exposures. A portfolio heavy in mega-cap technology carries concentrated exposure to AI spending, semiconductor cycles, and long-duration growth valuations. These exposures may be appropriate for some investors and inappropriate for others, but they should be deliberate rather than accidental. Regular review of holdings, weights, and risk contributions keeps the portfolio aligned with the investor's actual objectives and tolerance for drawdowns.
Diversification and Hedging Strategies
Diversification remains the most reliable defense against concentration risk. Allocating across sectors, geographies, and asset classes reduces dependence on any single narrative. For investors concerned about a technology-led drawdown, equal-weighted exposure, value tilts, and defensive sectors can provide ballast. Hedging with options or volatility products is possible but carries costs and complexity that make it unsuitable for many portfolios. The simplest and most robust approach is to ensure that no single theme or company can determine the portfolio's fate.
It is equally important to revisit assumptions periodically. Markets evolve, leadership rotates, and what worked in one regime may fail in the next. A disciplined review process, grounded in the investor's time horizon and risk capacity, prevents drift toward unintended concentration. The goal is not to predict the next rotation but to remain resilient across a range of outcomes. In a market carried by a few giants, that resilience is worth more than any forecast.
What This Session Signals for the Road Ahead
A single trading day is a data point, not a verdict, but the pattern it reveals deserves attention. When a narrow group of technology leaders can lift the index while the majority of stocks decline, the market is signaling that its foundation is concentrated. That concentration has delivered impressive returns for those exposed to the leaders, and it may continue to do so. It also creates a market that is more sensitive to company-specific news, more vulnerable to shifts in AI sentiment, and more dependent on a favorable macro backdrop than the headline index suggests.
Signals to Monitor
Investors should watch breadth, earnings revisions, and the dispersion of returns across sectors. Broadening leadership would be a constructive sign, indicating that the rally is drawing in more participants and building a sturdier base. Continued narrowing would suggest fragility. Earnings revisions for the mega-cap technology names matter enormously given their index weight; any downgrade cycle would test the market's resilience. Macro indicators, particularly inflation and rate expectations, provide the backdrop against which these company-level developments unfold.
It is also worth monitoring flows into passive versus active vehicles, as shifts in allocation can influence the mechanical forces described earlier. None of these signals offers a precise timing tool, but together they paint a picture of market health that is far richer than the index print. The disciplined investor treats them as inputs to a probabilistic assessment rather than as triggers for impulsive action, recognizing that markets can remain concentrated for longer than intuition suggests.
Balancing Optimism and Caution
The appropriate posture is neither euphoria nor despair but calibrated awareness. The AI-driven earnings cycle is real, and the companies leading it have delivered genuine growth. At the same time, the market's dependence on those companies is historically extreme, and extreme concentration has consequences. A portfolio that acknowledges both realities, participating in the upside while managing the downside, is better positioned than one that ignores either. The goal is to remain invested in the opportunities without becoming hostage to a single narrative.
Ultimately, the session that saw Nvidia and its peers lift the market despite Apple's decline is a reminder that headline numbers can obscure as much as they reveal. The investor who understands index mechanics, monitors breadth, and measures concentration is equipped to see through the surface. That understanding does not guarantee success, but it improves the odds of avoiding the most common mistake in top-heavy markets: mistaking the strength of a few for the health of the many.
From our network :
- Committed Mediterranean Precipitation Decline: Why Emissions Cuts Alone Cannot Restore Winter RainsNew NOAA research reveals that Mediterranean winter rains may decline irreversibly even with emissions cuts. Explore the science of committed climate change and regional impacts.
- Live Online English Classes for Kids: Do They Actually Reduce Anxiety?A ten-week study reveals that synchronous online English classes can significantly reduce child language anxiety while improving listening and reading skills. Discover what makes these programs effective and how parents can select the right one.
- Forbidden Matrix Patterns and Visible Lattice Points: A Geometric DictionaryExplore how multidimensional 0–1 matrices encode geometric truths, linking forbidden patterns to visible lattice points and hypergraph theory, with applications in combinatorics and computational geometry.
- Mobile Learning and VR in English: What Global Evidence Reveals About Effective Language TechnologyA systematic review across 14 countries reveals which language-learning technologies genuinely work. Mobile learning, AI, and VR show measurable benefits when pedagogically integrated. This evidence-based guide helps educators and learners select technology that delivers real return on investment.
- The Hidden Cost of AI Convenience: Why Over-Permissioned Agents Are a Security Time BombDiscover why AI agents with excessive permissions create dangerous single points of failure, and learn how implementing least privilege principles can protect your organization from exploitation.
- University Language Proficiency Exams: Why Institutional Tests Demand Different Preparation Than IELTS and TOEFLDiscover why university-specific language proficiency examinations differ fundamentally from IELTS and TOEFL, and learn strategic preparation approaches for institutional assessment success.
- The Final Descent: How ESA Retired the Legendary Cluster Constellation After 24 Years of Space Weather ScienceAfter 24 years mapping Earth’s magnetosphere, ESA’s Cluster mission concluded with a precisely controlled reentry over the South Pacific. This analysis explores the scientific legacy, engineering decisions, and debris mitigation principles behind one of space exploration’s most responsible retirements.
- CISA’s Ten-Advisory Wave: Why Generic Patching Fails in OT and How to Build Product-Specific PlaybooksCISA released ten ICS advisories in one week, exposing critical infrastructure risks. Generic patching fails in OT. Learn to build product-specific remediation playbooks.
- How AI Agents Will Change the Way We Manage Personal FinancesExplore how AI agents are transforming personal finance through automated budgeting, bill payment, and investment management, while examining the critical security protocols and governance frameworks required for safe deployment.
RESOURCES
- Resources will be updated soon.
- 01
- 02
- 03
- 04
- 05
- 06
- 07
- 08
0 Comments