
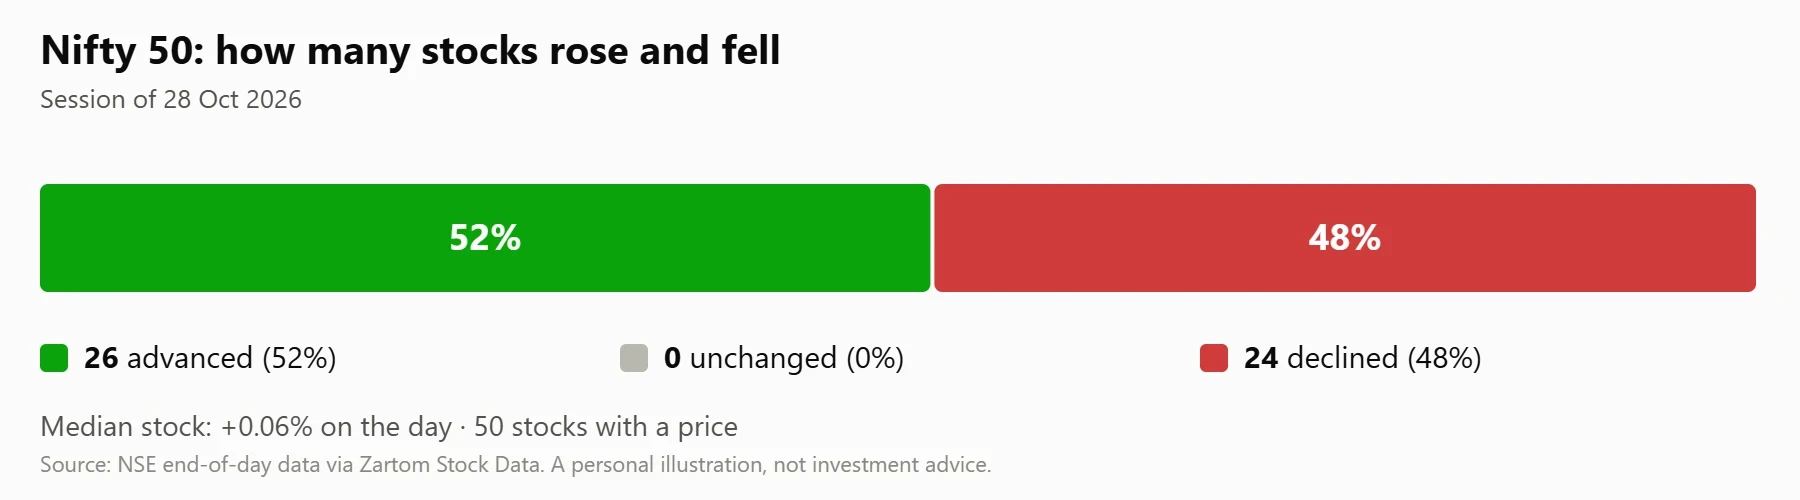
The Nifty 50 session on 28 October 2026 produced a split tape, with the advance-decline count landing almost exactly on the halfway line. Of the 50 stocks in the benchmark, 26 rose and 24 fell, leaving no unchanged names at the close.
That 52% versus 48% split describes a market without a decisive directional pull, where leadership in a handful of heavyweights offset weakness elsewhere in the index.
Beneath that balanced headline, the dispersion between individual names was far wider than the index-level count suggests. Apollo Hospitals Enterprise Ltd. closed at ₹8,137.00, up +4.43% on the day, while Infosys Ltd. finished at ₹1,123.15, down -3.43%.
On This Page
- The Session in Brief: A Balanced Breadth Count With Wide Internal Spread
- Biggest Gainers: Healthcare and Industrials Lead the Advance
- Biggest Decliners: IT and Energy Weigh on the Tape
- Stocks Near Their 52-Week Lows: Five Names in Close Range
- Unusually Heavy Trading: Three Stocks Double Their Average Volume
- One-Year Performance Extremes: BSE Leads, ITC Lags
- How to Read These Numbers: A Short Explainer
The gap between the best and worst performer exceeded seven percentage points, a reminder that breadth counts and price dispersion measure two different things.
This wrap walks through the verified end-of-day figures for the Nifty 50 on that date: the breadth tally, the median move, the biggest gainers and decliners, the stocks sitting near their 52-week lows, the names trading on unusually heavy volume, and the one-year performance extremes.
Every figure below is drawn from stored NSE prices and presented as a reading of past activity, not a forecast.
TL;DR The Nifty 50 closed 28 October 2026 with 26 of 50 stocks advancing and 24 declining, a median move of +0.06%, as APOLLOHOSP gained +4.43% and INFY fell -3.43%, with five stocks closing within 2% of their 52-week lows.
The Session in Brief: A Balanced Breadth Count With Wide Internal Spread
The headline breadth figure for 28 October 2026 was as close to a coin toss as an index session produces. Twenty-six of the fifty constituents advanced, twenty-four declined, and not a single stock closed exactly flat.
Market breadth, which simply counts how many stocks rise against how many fall, therefore described a market split down the middle rather than one leaning clearly in either direction.
The median stock moved +0.06% on the day, meaning the middle-ranked performer in the index was essentially unchanged. That median is a useful companion to the average, because it is not distorted by a few outsized moves at either end of the distribution.
A near-zero median alongside a seven-point spread between the best and worst name tells a specific story about dispersion.
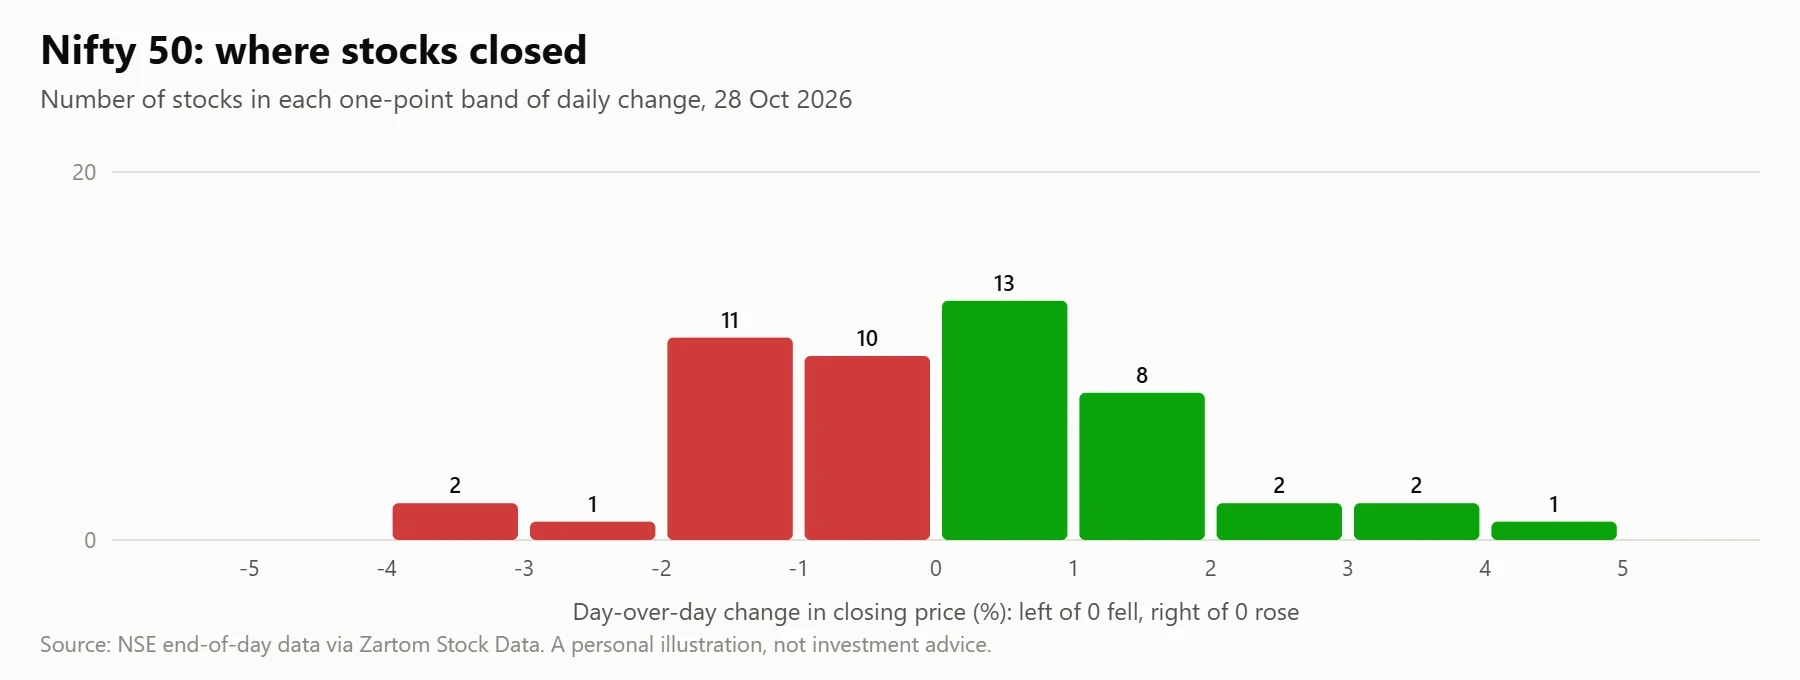
Dispersion, in this context, measures how far individual stock returns stray from the middle of the pack. A session can post a modest median while individual constituents swing sharply, and that is precisely what the 28 October tape showed.
The index-level count and the stock-level spread were telling two different, equally accurate stories about the same day.
Reading the Advance-Decline Split
An advance-decline ratio of 26 to 24 is the arithmetic expression of a market where buyers and sellers finished the session in near-perfect balance. Traders often watch this ratio because it captures participation across the index rather than the movement of a single headline number. A ratio close to one signals that neither side carried the day decisively.
The absence of any unchanged names is a small but telling detail. In a fifty-stock index, a flat close is uncommon, and zero such closes means every constituent moved at least marginally in one direction.
That granularity reinforces the picture of an active, two-sided session rather than a listless one where many names simply sat still.
What the Median Move Reveals
The median stock moved +0.06%, a figure that sits almost exactly at zero and describes the typical constituent rather than the average. Because the median ignores the size of extreme moves, it isolates the centre of the distribution.
A near-flat median tells us the middle of the market barely budged even as the tails swung hard.
This is where the distinction between breadth and dispersion becomes practical. Breadth said the market was evenly split; the median said the typical stock was flat; and the individual moves said the extremes were violent.
Each measure answers a different question, and reading them together gives a fuller picture than any single number alone.
We Also Published
Biggest Gainers: Healthcare and Industrials Lead the Advance
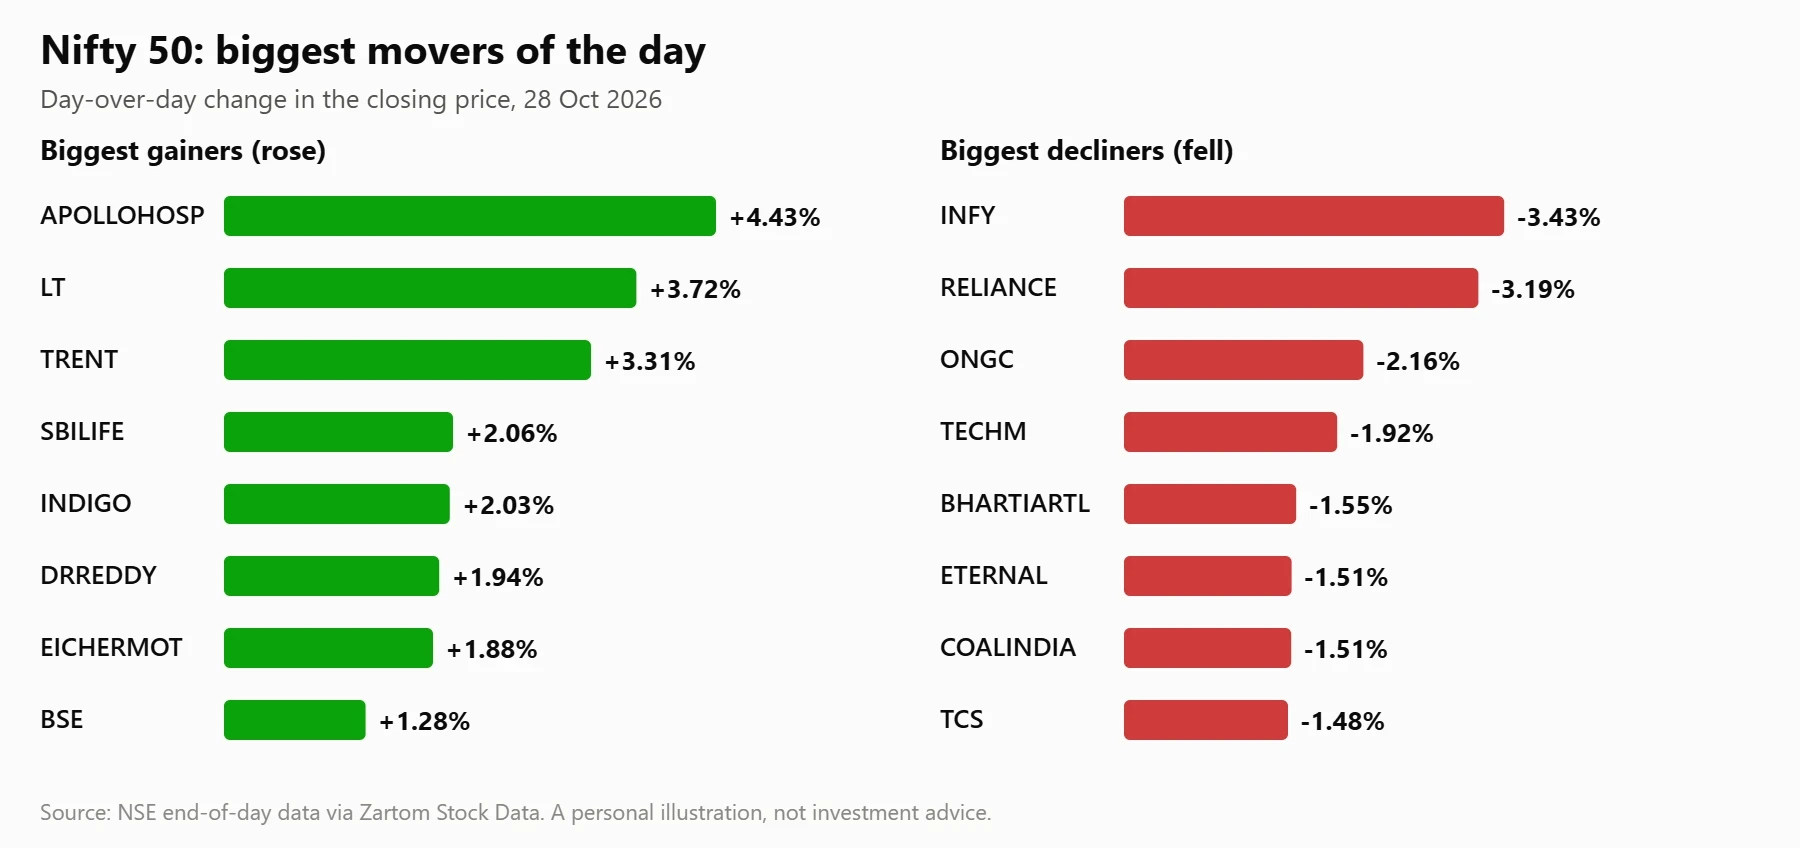
The day's strongest performers clustered in healthcare, capital goods and select financials, with Apollo Hospitals Enterprise Ltd. topping the list. A gainer, in market parlance, is simply a stock that closed higher than its previous close, and the size of that move is expressed as a percentage change day over day. The ten largest advances on 28 October spanned several distinct sectors.
Apollo Hospitals Enterprise Ltd. closed at ₹8,137.00, up +4.43% on the day, though its one-month move stood at -8.2%. That combination illustrates how a single strong session can occur within a longer stretch of weakness.
The one-month figure measures the change over roughly twenty-one trading sessions and provides context the daily number cannot.
Larsen & Toubro Ltd. rose +3.72% to ₹3,801.30, and Trent Ltd. gained +3.31% to ₹2,913.90. Both names also featured among the strongest one-month performers in the index, with Trent up +11.0% over that window. The remaining gainers delivered more modest but still positive daily moves across insurance, aviation, pharmaceuticals and banking.
- APOLLOHOSP (Apollo Hospitals Enterprise Ltd.): closed at ₹8,137.00, +4.43% on the day, -8.2% over one month
- LT (Larsen & Toubro Ltd.): closed at ₹3,801.30, +3.72% on the day, +0.9% over one month
- TRENT (Trent Ltd.): closed at ₹2,913.90, +3.31% on the day, +11.0% over one month
- SBILIFE (SBI Life Insurance Company Ltd.): closed at ₹1,666.70, +2.06% on the day, -3.6% over one month
- INDIGO (InterGlobe Aviation Ltd.): closed at ₹4,690.00, +2.03% on the day, -3.8% over one month
- DRREDDY (Dr. Reddy's Laboratories Ltd.): closed at ₹1,335.40, +1.94% on the day, +9.4% over one month
- EICHERMOT (Eicher Motors Ltd.): closed at ₹7,300.00, +1.88% on the day, +1.2% over one month
- BSE (BSE Ltd.): closed at ₹3,485.00, +1.28% on the day, +12.5% over one month
- SBIN (State Bank of India): closed at ₹956.80, +1.24% on the day, -0.5% over one month
- AXISBANK (Axis Bank Ltd.): closed at ₹1,220.00, +1.19% on the day, +0.8% over one month
Healthcare and Capital Goods in Focus
Apollo Hospitals and Dr. Reddy's Laboratories both appeared among the top gainers, giving the healthcare space two representatives in the day's leading group. Dr. Reddy's closed at ₹1,335.40, up +1.94%, and its one-month move of +9.4% showed the daily advance extending a firmer medium-term trend. Healthcare names thus contributed meaningfully to the advancing side of the ledger.
On the industrial side, Larsen & Toubro's +3.72% advance came on volume that was 2.8 times its 20-day average, a detail examined later in this wrap. Eicher Motors added +1.88% to close at ₹7,300.00.
The presence of capital goods and auto names among the leaders gave the gainers list a cyclical flavour alongside its defensive healthcare component.
Financials and Consumer Names Add Support
Three financial names featured among the top ten gainers: SBI Life Insurance, State Bank of India and Axis Bank. SBI Life rose +2.06% to ₹1,666.70, State Bank of India gained +1.24% to ₹956.80, and Axis Bank added +1.19% to ₹1,220.00. Their combined contribution helped keep the advancing count ahead of the declining one.
BSE Ltd. stood out with a +1.28% daily gain and a +12.5% one-month move, the strongest monthly figure in the gainers group. Trent's +11.0% monthly advance placed it close behind. These medium-term readings show that several of the day's leaders had already been building momentum over the preceding month.
Biggest Decliners: IT and Energy Weigh on the Tape
The decliners list was dominated by information technology and energy names, with Infosys Ltd. posting the steepest fall. A decliner is a stock that closed below its previous close, and the percentage change quantifies the size of that drop.
The ten largest declines on 28 October were concentrated in sectors that had, in several cases, delivered strong one-month returns.
Infosys Ltd. closed at ₹1,123.15, down -3.43% on the day, yet its one-month move remained +12.0%. That contrast is a recurring feature of daily market data: a sharp single-session pullback can occur even while the broader monthly trend stays positive. The daily figure captures one session; the monthly figure captures the path leading into it.
Reliance Industries Ltd. fell -3.19% to ₹1,158.00 and also appeared among the stocks closing near 52-week lows. Oil & Natural Gas Corporation declined -2.16% to ₹224.89. The energy complex thus contributed two of the day's three steepest declines, while technology names filled several more slots on the list.
- INFY (Infosys Ltd.): closed at ₹1,123.15, -3.43% on the day, +12.0% over one month
- RELIANCE (Reliance Industries Ltd.): closed at ₹1,158.00, -3.19% on the day, -3.3% over one month
- ONGC (Oil & Natural Gas Corporation Ltd.): closed at ₹224.89, -2.16% on the day, -2.2% over one month
- TECHM (Tech Mahindra Ltd.): closed at ₹1,776.60, -1.92% on the day, +15.2% over one month
- BHARTIARTL (Bharti Airtel Ltd.): closed at ₹1,948.10, -1.55% on the day, +10.0% over one month
- ETERNAL (Eternal Ltd.): closed at ₹326.00, -1.51% on the day, -1.5% over one month
- COALINDIA (Coal India Ltd.): closed at ₹392.00, -1.51% on the day, -7.2% over one month
- TCS (Tata Consultancy Services Ltd.): closed at ₹2,460.00, -1.48% on the day, +18.8% over one month
- BAJAJFINSV (Bajaj Finserv Ltd.): closed at ₹1,652.40, -1.47% on the day, -5.7% over one month
- HCLTECH (HCL Technologies Ltd.): closed at ₹1,400.50, -1.37% on the day, +11.8% over one month
Technology's Sharp Single-Session Pullback
Four technology names appeared among the ten biggest decliners: Infosys, Tech Mahindra, Tata Consultancy Services and HCL Technologies. Their daily moves ranged from -3.43% to -1.37%, yet their one-month returns were uniformly positive, spanning +11.8% to +18.8%. That pattern shows a sector giving back a portion of recent gains within a single session.
Tech Mahindra's -1.92% daily decline came despite a +15.2% one-month advance, and TCS's -1.48% session followed a +18.8% monthly gain. These figures describe the relationship between short-term and medium-term performance without implying anything about what comes next. The data simply records that the day's selling landed hardest on names that had recently risen.
Energy and Telecom Under Pressure
Reliance Industries and ONGC led the energy-related declines, falling -3.19% and -2.16% respectively. Bharti Airtel declined -1.55% to ₹1,948.10, adding a telecom name to the decliners list. Coal India slipped -1.51% to ₹392.00, extending a one-month move of -7.2% that was already negative heading into the session.
Bajaj Finserv rounded out the group with a -1.47% decline to ₹1,652.40, and its one-month move of -5.7% placed it among the softer medium-term performers. Eternal Ltd. fell -1.51% to ₹326.00. Together these names illustrate how weakness spread across energy, telecom, financial services and consumer platforms on the day.
Stocks Near Their 52-Week Lows: Five Names in Close Range
Five Nifty 50 constituents closed within 2% of their 52-week low on 28 October, a threshold that marks proximity to the lowest price each stock reached over the trailing year.
The 52-week low is a reference point many market participants track because it frames where the current price sits within its annual range. No stock closed within 2% of its 52-week high on the same day.
The asymmetry between zero names near annual highs and five near annual lows is a notable feature of the session. It suggests that, at least at the extremes of the annual range, more constituents were trading closer to the bottom of their twelve-month band than the top. This is a descriptive observation about price location, not a statement about direction.
Reliance Industries appeared on both the decliners list and the near-52-week-low list, closing at ₹1,158.00 against a 52-week low of ₹1,152.20. Tata Motors Passenger Vehicles closed at ₹263.60 against a low of ₹259.10, and Jio Financial Services at ₹205.15 against ₹202.51. HDFC Life Insurance and Nestle India completed the group.
Reliance and Tata Motors Passenger Vehicles
Reliance Industries closed at ₹1,158.00, just above its 52-week low of ₹1,152.20, after a -3.19% daily decline. Tata Motors Passenger Vehicles, by contrast, rose +0.92% to ₹263.60 while still sitting near its low of ₹259.10.
The two cases show that proximity to an annual low can coexist with either a rising or a falling daily move.
This distinction matters for interpretation. A stock can be near its 52-week low and still advance on the day, because the annual range and the daily change measure different time horizons.
Reading the two together prevents the mistake of assuming that every name near its low must have fallen in the latest session.
Financial and Consumer Names at the Lower End
Jio Financial Services declined -1.01% to ₹205.15 against a 52-week low of ₹202.51, and HDFC Life Insurance edged up +0.10% to ₹514.10 against a low of ₹508.05. Nestle India slipped -1.06% to ₹1,168.00, with its 52-week low at ₹1,147.40. These names span financial services and consumer staples.
The presence of two financial names and one consumer staple in this group broadens the picture beyond any single sector. It shows that proximity to annual lows was distributed across the index rather than confined to one industry. That distribution is a factual observation about where prices sat, not a commentary on prospects.
- 01
- 02
- 03
- 04
Unusually Heavy Trading: Three Stocks Double Their Average Volume
Three Nifty 50 stocks traded at least twice their 20-day average volume on 28 October. Average volume is the mean number of shares traded over the preceding twenty sessions, and a multiple of that figure flags a session where participation ran well above the recent norm. Volume surges are watched because they indicate that more shares changed hands than usual.
Larsen & Toubro led the group with volume at 2.8 times its 20-day average, alongside a +3.72% daily gain. Bajaj Auto traded at 2.7 times its average while rising +0.91% to ₹10,485.00. Hindustan Unilever rounded out the trio at 2.0 times its average, with a marginal -0.12% decline to ₹1,815.80.
The mix is instructive: two of the three heavy-volume names advanced while one slipped slightly. This shows that elevated turnover does not map neatly onto direction. Volume measures how much trading occurred, not which way the price moved, and the three cases illustrate that distinction clearly.
Larsen & Toubro's High-Volume Advance
Larsen & Toubro's 2.8-times-average volume accompanied a +3.72% gain to ₹3,801.30, making it the only name to appear on both the biggest-gainers and heavy-volume lists. When a large daily move coincides with elevated turnover, the session drew more participation than the recent norm. The data records that coincidence without assigning a cause.
The stock's one-month move stood at +0.9%, a modest figure that places the strong daily gain within a flatter medium-term path. This contrast between a sharp session and a subdued month is the same pattern seen among several decliners, simply in the opposite direction. Daily and monthly readings frequently diverge.
Bajaj Auto and Hindustan Unilever
Bajaj Auto traded at 2.7 times its average volume while rising +0.91% to ₹10,485.00, and its one-year return of +15.8% placed it among the index's stronger annual performers. Hindustan Unilever, at 2.0 times average volume, slipped -0.12% to ₹1,815.80. The two names show heavy turnover accompanying both a small gain and a marginal decline.
Hindustan Unilever's near-flat close is a reminder that a volume surge can occur on a day of minimal price change. Turnover and price movement are separate dimensions of a session, and the data here captures a case where one was elevated while the other was negligible. Both facts are simply recorded as they occurred.
One-Year Performance Extremes: BSE Leads, ITC Lags
Over the trailing twelve months, the spread between the Nifty 50's strongest and weakest constituents was substantial. BSE Ltd. posted a one-year return of +44.0%, the highest in the index, while ITC Ltd. recorded -37.9%, the lowest.
A one-year return measures the percentage change in price over roughly 250 trading sessions and captures a full annual cycle.
The strongest performers clustered in exchanges, ports, technology and consumer discretionary names. BSE Ltd. led at +44.0%, followed by Adani Ports and Special Economic Zone at +24.2% and Tech Mahindra at +22.7%. Titan Company added +16.7% and Bajaj Auto +15.8%, completing the top five annual performers among the fifty constituents.
At the other end, ITC Ltd. and Tata Motors Passenger Vehicles anchored the weakest group at -37.9% and -35.9% respectively. Jio Financial Services recorded -33.4%, HDFC Bank -31.7% and HDFC Life Insurance -31.2%.
The presence of two large private-sector financial names in this group is a notable feature of the annual performance table.
The Strongest Annual Performers
BSE Ltd.'s +44.0% one-year return stood well clear of the field, more than nineteen percentage points ahead of the second-placed Adani Ports at +24.2%. The exchange operator also posted a +12.5% one-month gain, showing that its annual strength extended into the recent period. Its daily move on 28 October was +1.28%.
Tech Mahindra's +22.7% annual return is notable because the stock was among the day's biggest decliners at -1.92%. This juxtaposition captures how a single weak session fits within a strong annual trend. Titan and Bajaj Auto completed the top five, with annual returns of +16.7% and +15.8% respectively.
The Weakest Annual Performers
ITC Ltd.'s -37.9% one-year return placed it at the bottom of the index, and its close of ₹259.50 came after a marginal -0.19% daily move. Tata Motors Passenger Vehicles followed at -35.9%, with its close of ₹263.60 sitting near its 52-week low. Both names thus appeared in the weakest annual group and near the bottom of their annual ranges.
Jio Financial Services at -33.4%, HDFC Bank at -31.7% and HDFC Life Insurance at -31.2% completed the weakest five. The inclusion of two large private-sector banks and an insurer in this group shows that annual underperformance was not confined to any single industry. These are historical price changes, recorded as they stood on the date.
How to Read These Numbers: A Short Explainer
Market wraps like this one assemble several distinct measurements, and each answers a different question about a single session. Breadth counts how many stocks rose or fell; the median describes the middle performer; dispersion captures how far the extremes strayed. Reading them together gives a more complete picture than any one figure alone.
Several terms recur throughout this report and are worth defining plainly. A 52-week high or low is the highest or lowest price a stock reached over the trailing year, and proximity to either frames where the current price sits within that annual band.
Average volume is the mean traded quantity over the prior twenty sessions, used as a baseline for spotting unusual turnover.
A one-year return measures the percentage change in price across roughly 250 trading sessions, while a one-month return covers about twenty-one. These period returns describe what already happened over different windows and are calculated from stored closing prices.
None of them forecasts what comes next, and each should be read as a record of past activity.
Breadth, Dispersion and the Median
Breadth, dispersion and the median are complementary tools rather than substitutes. Breadth tells you how many stocks moved in each direction; dispersion tells you how far apart the individual moves were; the median tells you where the typical stock landed. On 28 October, breadth was balanced, dispersion was wide, and the median was near zero.
Understanding these distinctions helps an ordinary reader interpret a headline like "26 advances, 24 declines" without over-reading it. That count describes participation, not the magnitude of moves. A market can be evenly split on breadth while individual stocks swing sharply, and this session was a clear example of exactly that combination.
Volume, Annual Ranges and Period Returns
Volume multiples, annual ranges and period returns each add a different layer of context. A volume multiple compares a session's turnover with the recent norm, an annual range places the current price within its twelve-month band, and period returns summarise price change over defined windows. None of these measures predicts direction on its own.
Reading them side by side is the practical takeaway. A stock near its 52-week low may have risen on the day; a heavy-volume name may have closed lower; a strong annual performer may have declined in the latest session.
The 28 October data contained examples of each, and the figures stand as a record of that single day's activity.
Disclaimer: This article is for general information and education only. It describes what historical prices and technical indicators showed on the date mentioned and does not predict future movements. It is not investment advice, a recommendation, or an offer to buy or sell any security.
Indicators are calculated from past data and can mislead, and all investments carry risk. Please consult a SEBI-registered investment adviser before making any financial decision.
From our network :
- The Final Descent: How ESA Retired the Legendary Cluster Constellation After 24 Years of Space Weather ScienceAfter 24 years mapping Earth’s magnetosphere, ESA’s Cluster mission concluded with a precisely controlled reentry over the South Pacific. This analysis explores the scientific legacy, engineering decisions, and debris mitigation principles behind one of space exploration’s most responsible retirements.
- Forbidden Matrix Patterns and Visible Lattice Points: A Geometric DictionaryExplore how multidimensional 0–1 matrices encode geometric truths, linking forbidden patterns to visible lattice points and hypergraph theory, with applications in combinatorics and computational geometry.
- Mobile Learning and VR in English: What Global Evidence Reveals About Effective Language TechnologyA systematic review across 14 countries reveals which language-learning technologies genuinely work. Mobile learning, AI, and VR show measurable benefits when pedagogically integrated. This evidence-based guide helps educators and learners select technology that delivers real return on investment.
- CISA’s Ten-Advisory Wave: Why Generic Patching Fails in OT and How to Build Product-Specific PlaybooksCISA released ten ICS advisories in one week, exposing critical infrastructure risks. Generic patching fails in OT. Learn to build product-specific remediation playbooks.
- University Language Proficiency Exams: Why Institutional Tests Demand Different Preparation Than IELTS and TOEFLDiscover why university-specific language proficiency examinations differ fundamentally from IELTS and TOEFL, and learn strategic preparation approaches for institutional assessment success.
- How AI Agents Will Change the Way We Manage Personal FinancesExplore how AI agents are transforming personal finance through automated budgeting, bill payment, and investment management, while examining the critical security protocols and governance frameworks required for safe deployment.
- Committed Mediterranean Precipitation Decline: Why Emissions Cuts Alone Cannot Restore Winter RainsNew NOAA research reveals that Mediterranean winter rains may decline irreversibly even with emissions cuts. Explore the science of committed climate change and regional impacts.
- The Hidden Cost of AI Convenience: Why Over-Permissioned Agents Are a Security Time BombDiscover why AI agents with excessive permissions create dangerous single points of failure, and learn how implementing least privilege principles can protect your organization from exploitation.
- Live Online English Classes for Kids: Do They Actually Reduce Anxiety?A ten-week study reveals that synchronous online English classes can significantly reduce child language anxiety while improving listening and reading skills. Discover what makes these programs effective and how parents can select the right one.
RESOURCES
- CLOSING MARKET WRAP (28th OCTOBER 2026) Indian ... - Xx.com4 hours ago ... Broad market breadth on the NIFTY50 index remained relatively balanced, with 26 stocks advancing into positive territory while 24 stocks ...
- Sunil Subramaniam's Post - LinkedInlinkedin.comOct 3, 2026 ... Weekly Market Wrap — 28 Sep – 1 Oct 2026 Headline: A global bond rout and crude spike drove the…
- 6 July 2026: Sensex, Nifty End Higher - Kotak Neokotakneo.comJul 6, 2026 ... Market Wrap, 6 July 2026: Sensex And Nifty 50 End On A Solid Footing ... Closing Bell, 28 October 2026:…
- Market wrap of the week: 19th Oct - 23rd Oct 2026 From gains and ...instagram.com5 days ago ... Market wrap of the week: 24th Aug - 28th Aug 2026 From ... - Markets End the Week on a…
- Sensex, Nifty Under Pressure As Nifty IT Falls Over 5% - Kotak Neokotakneo.comJun 3, 2026 ... Market Wrap, 3 June 2026: Sensex, Nifty End In Red Despite Recovery Attempt ... Closing Bell, 28 October 2026: Sensex…
- Morning Wrap: ASX 200 to rise, chipmakers lift the S&P 500 and ...marketindex.com.auLead Writer. Wed 28 Oct 2026, 08:36 AEDT (2h ago). ∙8 min read. Share. Print Article ... Nifty 50. 73,599. -0.01%. Nikkei 225. 63,268.…
- Market wrap of the week: 14th Sept-18th Sept 2026 From gains and ...instagram.comSep 18, 2026 ... 4 likes. indiabullssec. Market wrap of the week: 19th Oct - 23rd Oct 2026 ... The Nifty 50 and Sensex…
- Kalkine - Indian Stock Market Insights | Nifty 50, Sensex & NSEkalkine.co.inDaily Wrap Oct 28, 2026 ...
- Sensex Today, Nifty 50 | Stock Market Live Updates - Facebookfacebook.com13 hours ago ... Stock Market Today Live, October 28: Nifty 50, Sensex to open on cautious ... NSE, share prices and Indian stock…
- Market Wrap: Sensex & Nifty Today, Explained | Wealth Northwealthnorth.inThe Long Reads. 50 explainers in view — one per issue. 26 OCT 2026 · Macro. What gold's role as a safe-haven ...
- Sri Lanka market summary for week ending October 2nd, 2026facebook.comOct 11, 2026 ... USA MARKET WEEKLY REPORT 28 September – 2 October 2026 Major ... Market Highlights: NIFTY 50: 23,146.2 (+2.8%) BANK NIFTY ...
- NIFTY 50 - Wikipediaen.wikipedia.orgAsian Paints was also a constituent of Nifty 50 from 18 September 1996 to 28 October 2002 ... ↑ "Market 2025 wrap: NIFTY50 gains…
- Market wrap, Oct 9: SENSEX jumps 879 pts, NIFTY50 ends above ...upstox.comBandhan Bank has a total market capitalisation of ₹25,030.86 crore as of October 28, 2026, according to data on the NSE. With inputs from…
- Indian Stock Market Today 28 Oct 2026 - Vittarthi Financial Calculatorsvittarthi.com2 days ago ... Indian stock market closing summary for 28 Oct 2026. Nifty 50 ... Market Wrap-Up. Data-driven summary. ⏱️ 06:30 PM. Indian…
- 01
- 02
- 03
- 04
- 05
- 06
- 07
- 08
0 Comments