The analytical evaluation of the National Stock Exchange equities landscape for the trading session dated 6 Oct 2026 presents a comprehensive view of market breadth, price momentum, and volumetric shifts. Financial markets operate through continuous price discovery, reflecting the aggregate sentiment of thousands of participating entities across diverse market capitalisation segments. By examining end-of-day pricing metrics, quantitative software computes aggregate statistics that characterize the session without relying on external corporate announcements, macroeconomic developments, or subjective forecasting models. Observers of market mechanics rely on such structured data to understand the underlying currents of the exchange on any given business day. Market breadth provides a foundational measure of participation, illustrating whether price appreciation is concentrated within a narrow cohort or distributed broadly across the entire trading universe. During this session, the analysis encompasses 2599 stocks, capturing the complete cross-section of activity. Understanding the balance between advancing and declining issues allows market participants to evaluate the systemic health of the exchange. The quantitative breakdown establishes a clear picture of how individual equities behaved relative to the broader benchmark indices, serving as an empirical baseline for subsequent technical review.
TL;DR The NSE equities session on 6 Oct 2026 featured broad participation with 1775 stocks advancing against 787 decliners, while the median stock recorded a daily change of +0.90%.
On This Page
The Session in Brief and Market Breadth
Market breadth measures the proportion of advancing stocks relative to declining stocks, indicating the overall participation rate of the trading session. On 6 Oct 2026, the aggregate dataset of 2599 stocks revealed that 1775 equities rose, representing 68% of the total universe. Meanwhile, 787 stocks fell, accounting for 30% of the sample, while 37 stocks remained unchanged. The median stock moved +0.90% on the day, capturing the central tendency of daily price changes across the entire exchange. The distribution of daily changes highlights the dispersion of returns among all monitored equities. Volume participation and directional movement together form the bedrock of technical market interpretation, showing how capital flowed across large, mid, and small-cap segments during the trading hours.
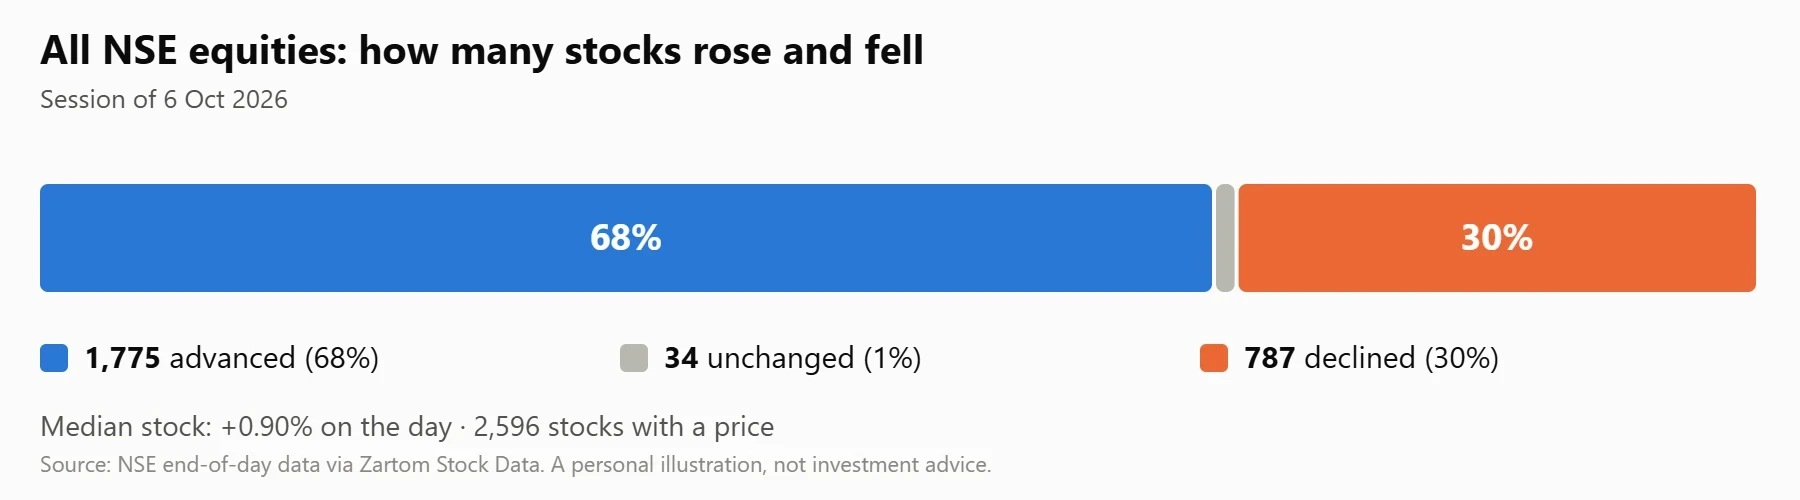
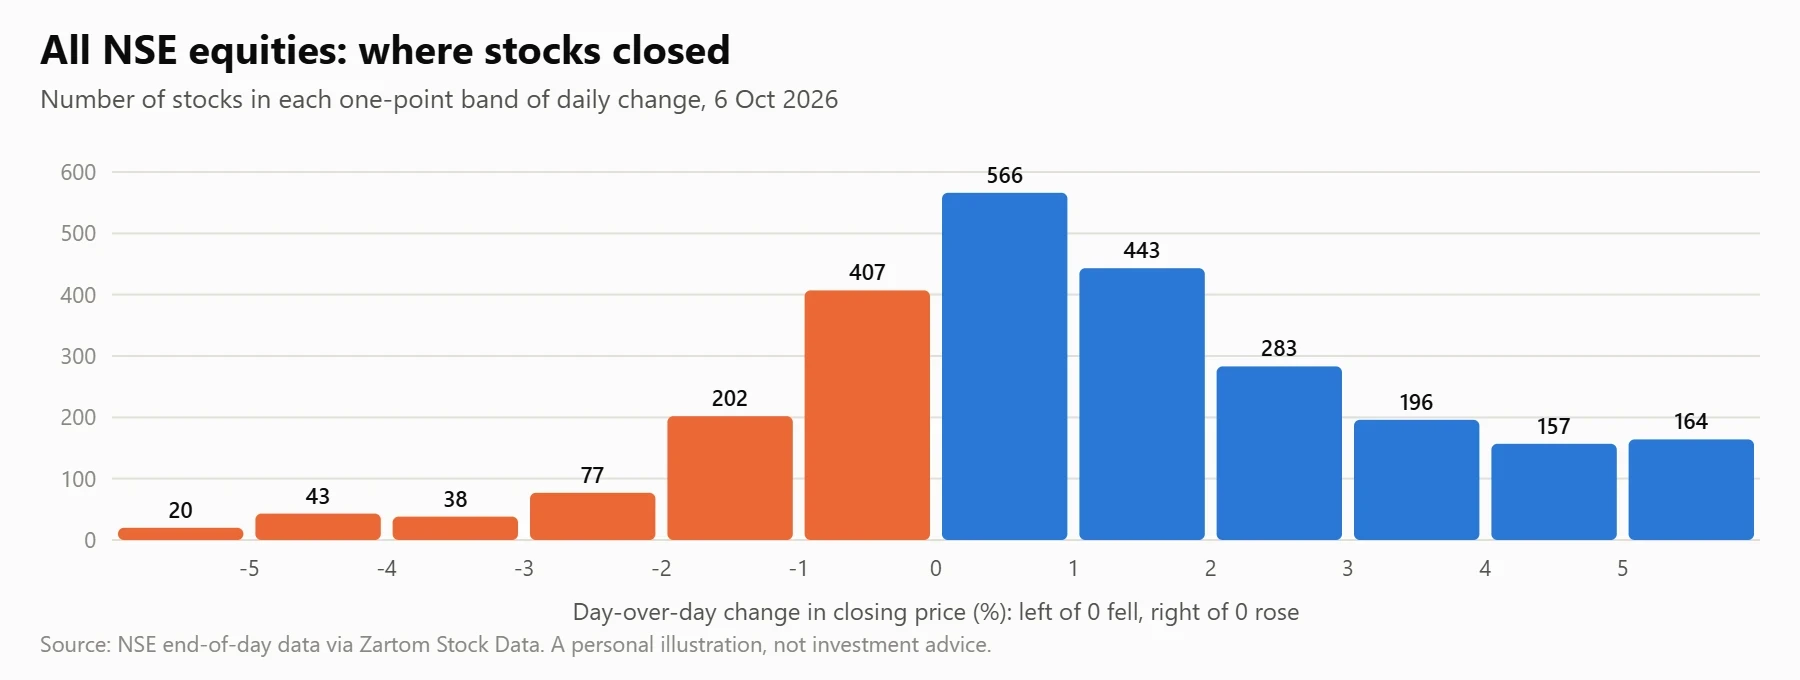
The distribution of daily price changes across the 2596 stocks analyzed further clarifies the structural shape of the session. The median stock change of +0.90% indicates a positively skewed central tendency within the broader cross-section of equities.
Biggest Gainers and Decliners of the Session
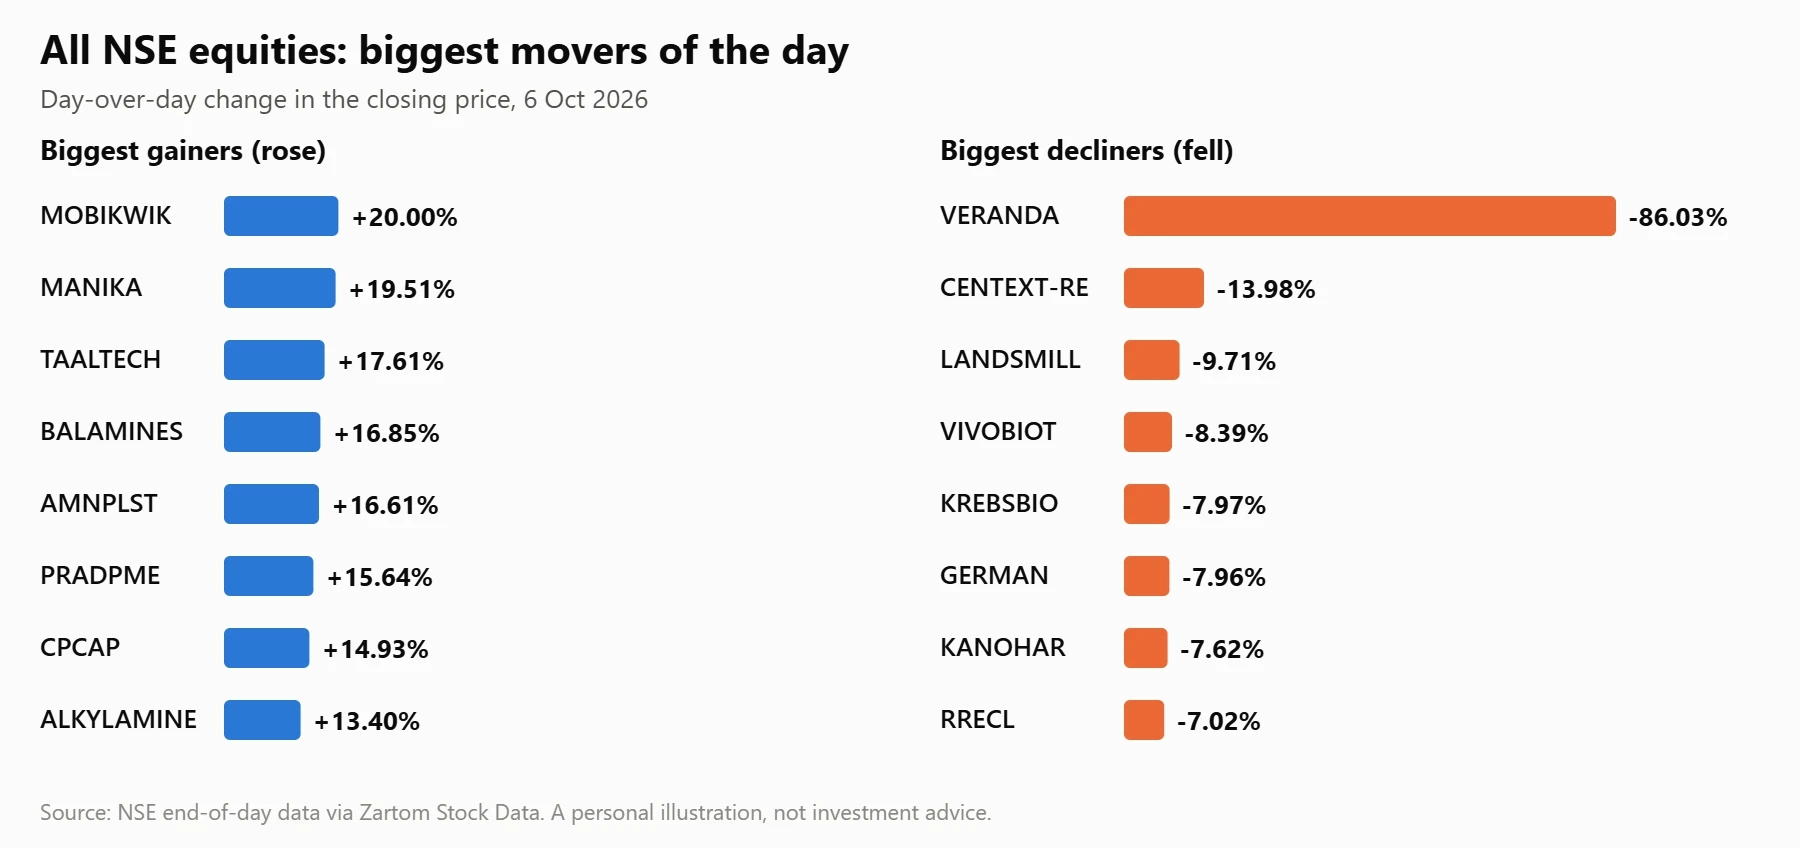
The identification of extreme price movements highlights individual equities exhibiting the highest percentage changes during the trading day. Among the biggest gainers, MOBIKWIK (One Mobikwik Systems Limited) closed at ₹242.14, registering a day-over-day change of +20.00% and a 1-month change of +26.0%. MANIKA (Manika Plastech Limited) closed at ₹51.52 with a gain of +19.51%, while TAALTECH (Taal Tech Limited) closed at ₹1,093.40, marking a +17.61% day change and +21.4% over one month. Additional top advancers included BALAMINES at ₹2,287.70 (+16.85%), AMNPLST at ₹186.92 (+16.61%), PRADPME at ₹544.25 (+15.64%), CPCAP at ₹154.53 (+14.93%), ALKYLAMINE at ₹1,962.20 (+13.40%), OPTIEMUS at ₹889.90 (+13.19%), and TRENT at ₹2,906.00 (+12.64%). Conversely, significant downward movements occurred in several names. VERANDA (Veranda Learning Solutions Limited) recorded a sharp decline, closing at ₹29.72 with a day change of -86.03% and a 1-month change of -87.8%. CENTEXT-RE (Century Extrusions Limited-RE) closed at ₹2.40, down -13.98%. LANDSMILL (Landsmill Green Limited) finished at ₹0.93, representing a -9.71% day change alongside a +47.6% 1-month return. Further notable decliners included VIVOBIOT at ₹13.87 (-8.39%), KREBSBIO at ₹58.86 (-7.97%), GERMAN at ₹118.12 (-7.96%), KANOHAR at ₹942.50 (-7.62%), RRECL at ₹125.17 (-7.02%), VTMLTD at ₹35.92 (-6.14%), and MPIMANIPAL at ₹366.05 (-6.07%).
Stocks Approaching 52-Week Highs and Lows
Evaluating proximity to annual price extremes provides structural context regarding trend continuation and long-term price positioning. The dataset identifies 70 stocks closing within 2% of their respective 52-week highs. Notable examples include CUPID (Cupid Ltd.), closing at ₹324.20 against a 52-week high of ₹324.95 following a +4.55% daily move. SUPREMEENG closed at ₹4.40 with a 52-week high at ₹4.40 (+1.85%). SWANDEF closed at ₹2,760.20 against a high of ₹2,804.90 (+1.15%), while GFSTEELS closed at ₹39.83 matching its high of ₹39.83 (+2.00%). HFCL reached ₹262.78, matching its high of ₹262.78 (+5.00%). Other equities near annual peaks included ONELIFECAP at ₹45.00 (high ₹45.25), SHREEJISPG at ₹796.50 (high ₹799.50), SPECTRUM at ₹3,915.90 (high ₹3,980.00), MOREPENLAB at ₹143.96 (high ₹145.25), and KMEW at ₹3,202.30 (high ₹3,242.00). On the opposite end of the spectrum, 114 stocks closed within 2% of their 52-week lows. OSIAHYPER closed at ₹2.00, down -4.31% against a low of ₹1.99. GENSOL closed at ₹12.35 matching its low of ₹12.35 (-5.00%). ELIN closed at ₹78.84 near its low of ₹78.00 (-0.16%), while URAVIDEF finished at ₹102.00 near its low of ₹100.00 (+0.83%). Additional names near annual troughs included RHFL at ₹1.56 (low ₹1.53), KPITTECH at ₹492.70 (low ₹484.50), PAKKA at ₹69.13 (low ₹68.66), VIKRAMSOLR at ₹151.50 (low ₹150.96), GANESHCP at ₹145.47 (low ₹144.75), and SHRENIK at ₹0.27 matching its low of ₹0.27 (-3.57%).
Unusually Heavy Trading Volume Activity
Volume surges serve as a vital metric for tracking institutional interest and liquidity concentration, measuring turnover relative to historical averages. The session recorded 212 stocks trading at least twice their 20-day average volume. Prominent examples of heavy trading activity include HBESD (HB Estate Developers Limited), closing at ₹75.03 with a day change of -3.97% on a volume of 16.9x the 20-day average. ALKYLAMINE traded at 15.5x average volume, closing at ₹1,962.20 up +13.40%. CELLO recorded 14.8x average volume at a closing price of ₹369.15 (+8.56%). Further instances of heightened volume include AMNPLST at 14.2x average volume (close ₹186.92, +16.61%), INDOAMIN at 13.9x average volume (close ₹161.16, +12.46%), and DPWIRES at 12.8x average volume (close ₹221.54, +12.58%). DMCC SPECIALITY CHEMICALS LIMITED saw volume reach 11.3x average (close ₹355.80, +11.50%), Coral India Finance & Housing Limited recorded 10.3x average volume (close ₹31.18, +3.21%), One Mobikwik Systems Limited registered 10.1x average volume (close ₹242.14, +20.00%), and Dhanlaxmi Bank Limited traded at 9.9x average volume (close ₹28.83, +8.83%).
- 01
- 02
- 03
- 04
We Also Published
One-Year Performance Extremes
Long-term performance tracking highlights the strongest and weakest historical trajectories across the exchange over a trailing 12-month period. Among the strongest 1-year performers, STLTECH (Sterlite Technologies Ltd.) recorded a 1-year return of +742.1%, closing at ₹1,016.70 (+1.54% on the day). SIGMAADV (Sigma Advanced Systems Ltd.) achieved a 1-year return of +645.4%, closing at ₹1,119.40 (-0.99% daily). CUPID recorded +645.0% over the trailing year, closing at ₹324.20. AGASTYAEN registered +562.0% over 1 year (close ₹66.80, -2.00%), and SUPREMEENG achieved +436.6% over 1 year (close ₹4.40, +1.85%). Conversely, the weakest 1-year performers demonstrated significant drawdowns from historical levels. BESTAGRO (Best Agrolife Limited) recorded a 1-year change of -92.8%, closing at ₹17.89 (+0.90% daily). OSIAHYPER registered a 1-year decline of -91.7% (close ₹2.00, -4.31%). DELPHIFX recorded a 1-year change of -91.0% (close ₹7.17, +1.99%), INDOTHAI stood at -87.6% over 1 year (close ₹38.78, +4.98%), and VERANDA recorded a 1-year decline of -87.2% (close ₹29.72, -86.03%).
How to Read These Market Numbers
Interpreting quantitative market wraps requires an understanding of how individual metrics relate to overall market behavior. Market breadth measures the proportion of advancing versus declining issues, revealing the internal participation level of a trading session. Volume multiples compare current session turnover against the 20-day moving average volume, measuring liquidity expansion and institutional interest. Proximity to 52-week highs and lows tracks price positioning within annual boundaries, illustrating whether equities are consolidating near peaks or troughs. Analyzing median price changes provides a central measure of performance that avoids distortion from extreme outliers. Reviewing verified facts computed from stored historical prices ensures that observations remain grounded strictly in recorded exchange data. This is a personal illustration of what the price data and technical indicators show on the date above. It is not investment advice, a recommendation, or an offer to buy or sell any security. Past performance does not guarantee future results.
From our network :
- The Hidden Cost of AI Convenience: Why Over-Permissioned Agents Are a Security Time BombDiscover why AI agents with excessive permissions create dangerous single points of failure, and learn how implementing least privilege principles can protect your organization from exploitation.
- Forbidden Matrix Patterns and Visible Lattice Points: A Geometric DictionaryExplore how multidimensional 0–1 matrices encode geometric truths, linking forbidden patterns to visible lattice points and hypergraph theory, with applications in combinatorics and computational geometry.
- Committed Mediterranean Precipitation Decline: Why Emissions Cuts Alone Cannot Restore Winter RainsNew NOAA research reveals that Mediterranean winter rains may decline irreversibly even with emissions cuts. Explore the science of committed climate change and regional impacts.
- Mobile Learning and VR in English: What Global Evidence Reveals About Effective Language TechnologyA systematic review across 14 countries reveals which language-learning technologies genuinely work. Mobile learning, AI, and VR show measurable benefits when pedagogically integrated. This evidence-based guide helps educators and learners select technology that delivers real return on investment.
- CISA’s Ten-Advisory Wave: Why Generic Patching Fails in OT and How to Build Product-Specific PlaybooksCISA released ten ICS advisories in one week, exposing critical infrastructure risks. Generic patching fails in OT. Learn to build product-specific remediation playbooks.
- University Language Proficiency Exams: Why Institutional Tests Demand Different Preparation Than IELTS and TOEFLDiscover why university-specific language proficiency examinations differ fundamentally from IELTS and TOEFL, and learn strategic preparation approaches for institutional assessment success.
- The Final Descent: How ESA Retired the Legendary Cluster Constellation After 24 Years of Space Weather ScienceAfter 24 years mapping Earth’s magnetosphere, ESA’s Cluster mission concluded with a precisely controlled reentry over the South Pacific. This analysis explores the scientific legacy, engineering decisions, and debris mitigation principles behind one of space exploration’s most responsible retirements.
- Live Online English Classes for Kids: Do They Actually Reduce Anxiety?A ten-week study reveals that synchronous online English classes can significantly reduce child language anxiety while improving listening and reading skills. Discover what makes these programs effective and how parents can select the right one.
- How AI Agents Will Change the Way We Manage Personal FinancesExplore how AI agents are transforming personal finance through automated budgeting, bill payment, and investment management, while examining the critical security protocols and governance frameworks required for safe deployment.
RESOURCES
- Now Market Research in Your Language! AI-powered ... - Facebookfacebook.com7 days ago ... What you get on #KwalaIntel ✓ Stock & Commodity Research ✓ Interactive Charts & Market Insights ✓ 2,800+ NSE and…
- Market Data - NSEnseindia.comGet all latest share market news, live charts, analysis, ipo, stock/share tips, indices, equity ... VOLUME (shares). VALUE (₹ Crores). 52 WEEK HIGH. 52…
- Market Wrap: All-Share Index drops 52 Points; UPL leads gainers ...facebook.comDec 27, 2024 ... Most stocks have received more bullish ratings, signalling optimism about their performance, while some stocks were under review. In the ...
- Religare Dynami: Stocks, IPOs - App Store - Appleapps.apple.com... markets across NSE, BSE, MCX, and NCDEX. ... Track Holdings Instantly: Monitor your portfolio's real-time market value and performance on the go.
- NSE India Enters Top 10 Global Exchanges List - LinkedInlinkedin.comAug 26, 2025 ... ... stock exchange. This rise reflects an increase in revenue projections, a booming IPO market, and strong derivatives performance. Ranked…
- 2026 Market Outlook | J.P. Morgan Global Researchjpmorgan.com“At the heart of our outlook is a multidimensional polarization: equity markets split between AI and non-AI sectors, a U.S. economy balancing robust capex…
- Weekly Market Recap - Manulife John Hancock Investmentsjhinvestments.com... market equities, fixed income ... market trends and financial stock performance. Capital Market Performance Report. Detailed weekly data on equities ...
- Stocks - Bloomberg - Bloomberg Marketsbloomberg.comUpdated world stock indexes. Get an overview of major world indexes, current values and stock market data.
- Nairobi Securities Exchange (NSE)nse.co.keFounded in 1954, NSE has a six decade heritage in listing equity and debt securities ... Equities Market · Main Investment Market Segment ·…
- Profitability, Investment Factors and Trading Volume Adjustment on ...publishing.globalcsrc.orgSep 3, 2024 ... The Equity Premium (EP) is to be of focus especially in the Nairobi securities exchange (NSE) and other emerging markets…
- A Technical Analysis Based Prediction of Stock Market Trading ...ijisae.orgOct 1, 2022 ... ... (NSE) - Indian stock market over the period of 6 ... Stock Market Performance and Macroeconomic Factors: The Study…
- Daily Market Wrap - Kingdom Securities Limitedkingdomsecurities.co.keSep 8, 2025 ... Market Indicators: The equities market closed with a mixed performance, with the NASI falling 0.82% to. 176.82 points, while the…
- Euronext Markets: Real-time Stock Market Data | livelive.euronext.comSYDNEY, Oct 7 (Reuters) - Asian markets were slightly weaker on Wednesday even though US stocks touched new highs, as oil prices rose with…
- Weekly Report - Nigerian Exchange Limitedngxgroup.comWEEKLY MARKET SUMMARY REPORTS. Weekly Market Report for the Week Ended 02-10-2026.pdf · Weekly Market Report for the Week Ended 25-09-2026.pdf.
- Bloomberg Terminal Functions & Shortcuts - Complete Listcorporatefinanceinstitute.comAug 20, 2019 ... Bloomberg Functions List ; News · N · News ; Broad Market Screens · WEI, World Equity Indices ; Market…
- 01
- 02
- 03
- 04
- 05
- 06
- 07
- 08
0 Comments