
In today's hyper-connected financial landscape, successful participants must rise above the emotional static of daily market volatility to anchor their decisions firmly in cold, hard quantitative reality.
Our market wrap cuts through the clutter, exploring the structural mechanics of 2,599 NSE-listed equities by examining market breadth, momentum, and volume distributions. By breaking down verified end-of-day statistics from October 7, 2026, we provide a crystal-clear lens on how capital flowed dynamically across large-, mid-, and small-capitalization segments.
Our analytical mandate remains purely descriptive: mapping out closing prices, 52-week thresholds, and volume multipliers with zero speculation or prescriptive advice. Because market participants frequently grapple with the overwhelming volume of daily listings, structured post-session reviews serve as an indispensable tool for achieving true technical clarity.
Every percentage gain, volume surge, and trailing twelve-month extreme detailed here is processed directly from certified software outputs. This foundational overview establishes an exceptionally reliable baseline for financial journalists, researchers, and quantitative analysts who demand exact numerical truths.
As we delve into advance-decline ratios and sector-wide participation rates, our objective is unmistakable: to document the precise state of Indian equities with uncompromising mathematical accuracy and professional editorial poise.
TL;DR On 7 October 2026, 42% of NSE equities advanced while 57% declined, with India Glycols leading gainers up +19.99% and a median stock move of -0.36%.
On This Page
The Session in Brief
The broader trading session on October 7, 2026, encapsulated a cautious sentiment across the National Stock Exchange, reflecting a negative skew in overall market breadth. Out of the 2,599 equities tracked by Zartom Stock Data, exactly 1,089 stocks recorded positive session returns, representing roughly 42% of the universe. Conversely, 1,475 stocks closed in negative territory, accounting for 57% of the total exchange listings. A minor cohort of 35 stocks remained entirely unchanged from their previous closing prices. The median stock across the entire exchange registered a day-over-day change of -0.36%, illustrating a mild downward pressure on typical day-to-day valuations.
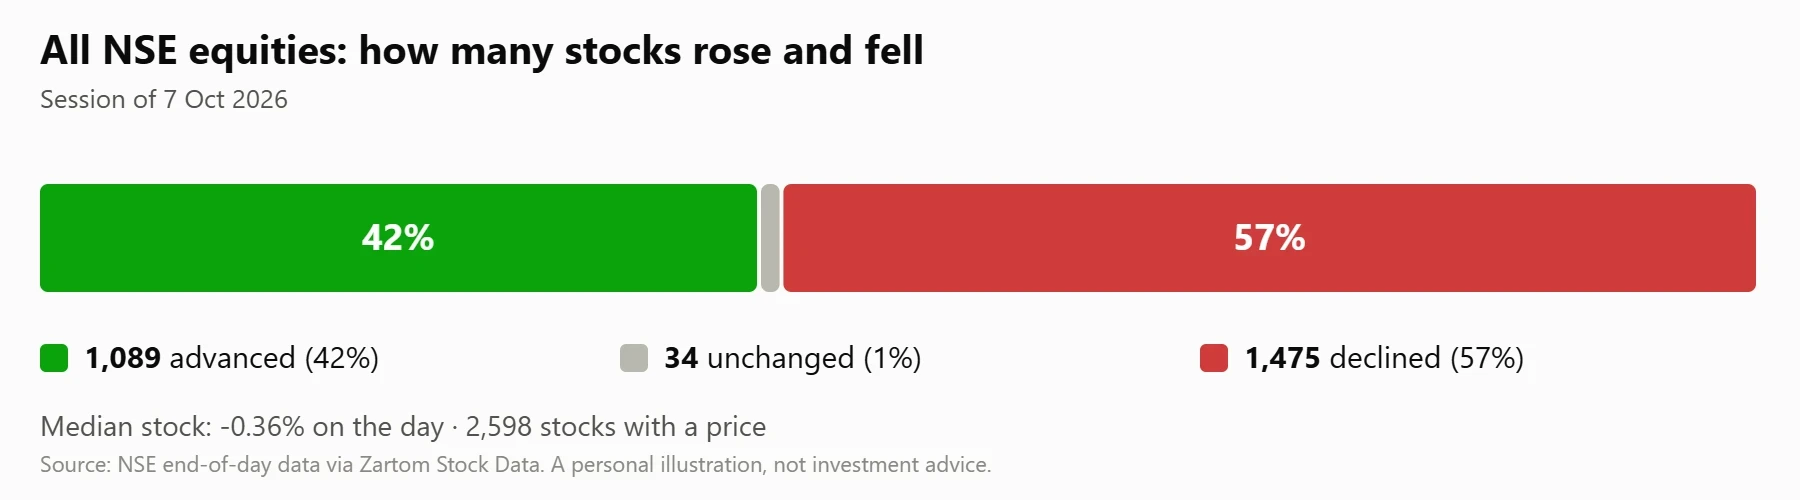
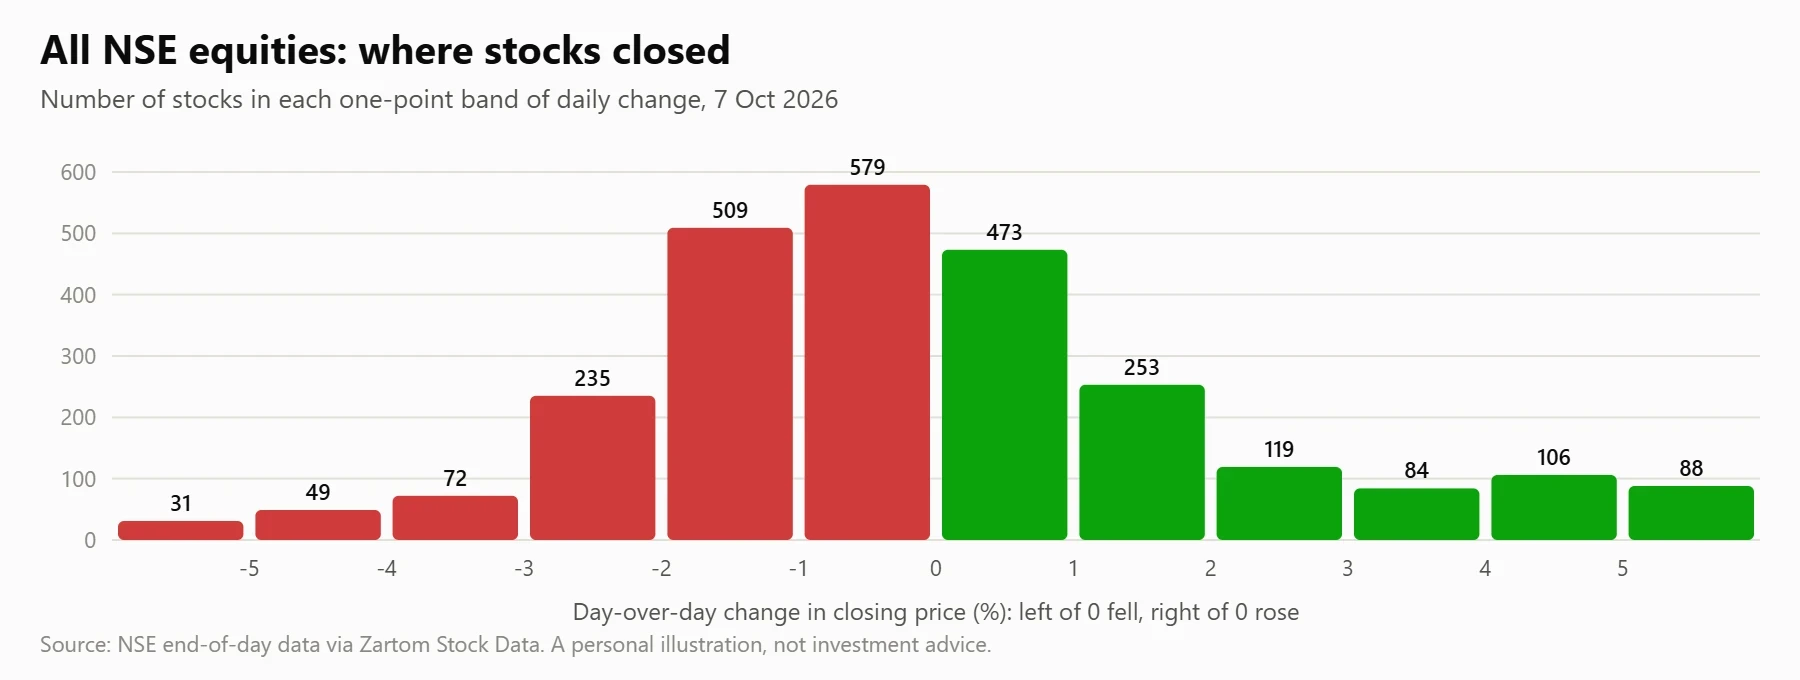
To contextualize these session dynamics further, we examine the quantitative distribution of daily percentage shifts across all participating listings. The advance-decline ratio remains a primary gauge of market breadth, measuring the relative strength of advancing stocks against declining ones to reveal underlying participation trends. A negative breadth reading indicates that selling pressure was distributed more widely than buying interest during this particular trading window. Investors and researchers observe these baseline participation metrics to gauge whether a session's price movement is broad-based or driven by a narrow segment of index heavyweights.
Biggest Gainers and Decliners
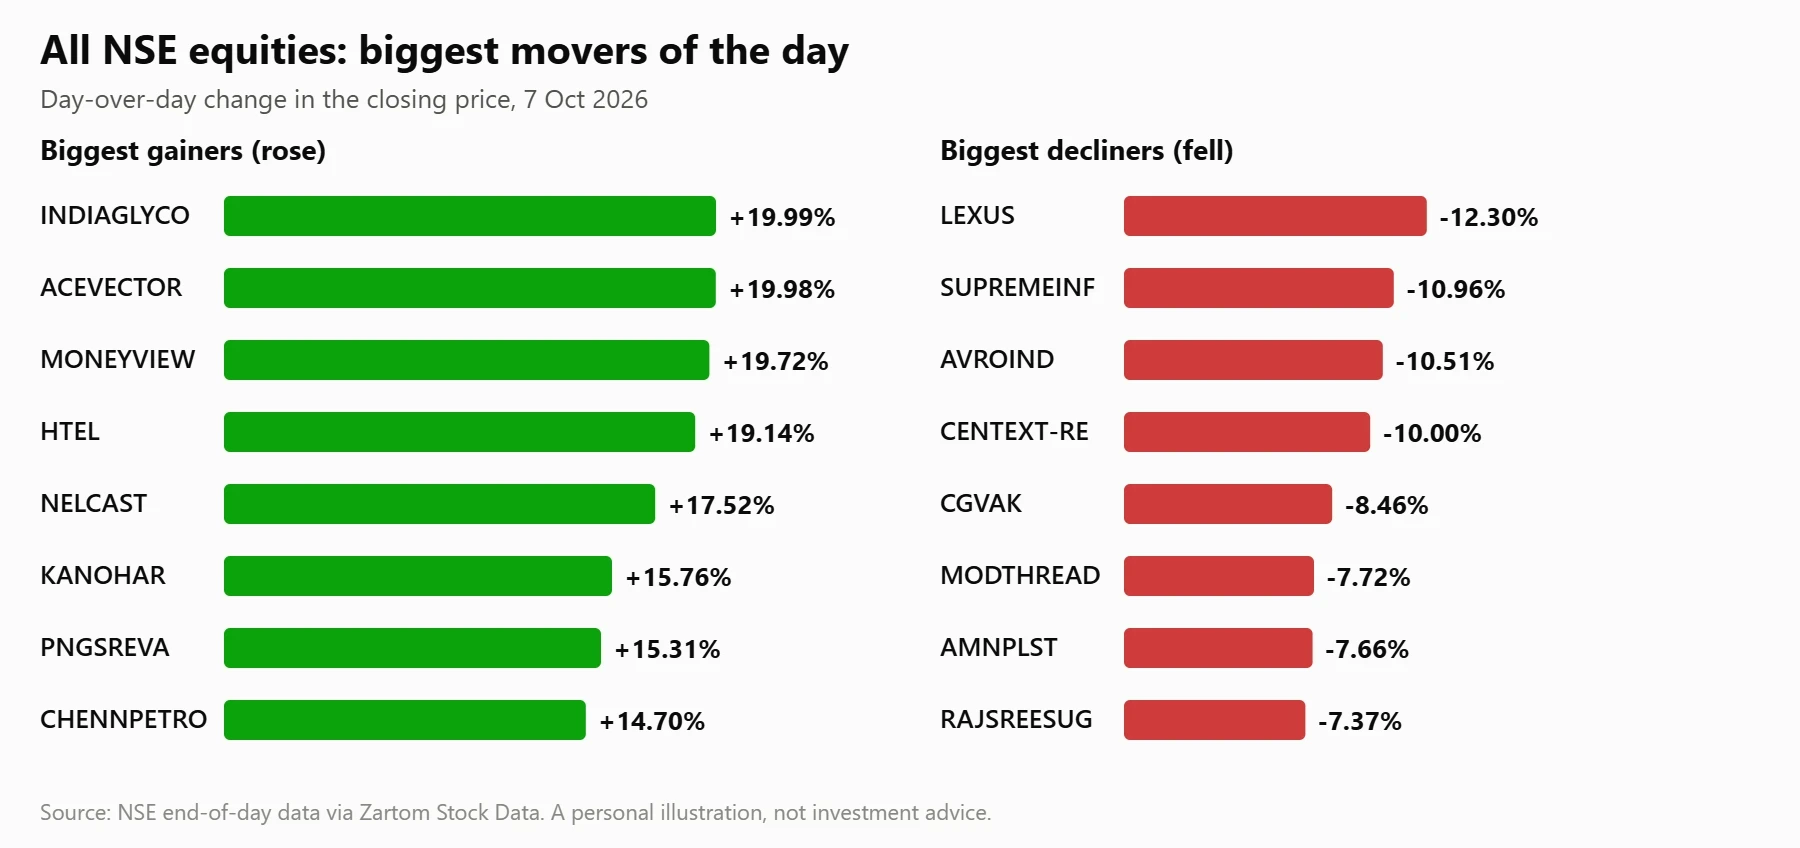
Individual stock performance during the session revealed sharp divergences, with several equities experiencing intense upward momentum while others faced substantial downward corrections. The top-performing tier was spearheaded by specialty chemical and industrial enterprises, showing double-digit percentage expansions on significant trading volumes.
- INDIAGLYCO (India Glycols Ltd.): closed at ₹382.70, +19.99% on the day, +40.0% over one month
- ACEVECTOR (AceVector Limited): closed at ₹31.11, +19.98% on the day, 1 month data unavailable
- MONEYVIEW (Moneyview Limited): closed at ₹60.46, +19.72% on the day, 1 month data unavailable
- HTEL (Hy-Tech Engineers Limited): closed at ₹87.94, +19.14% on the day, +20.1% over one month
- NELCAST (Nelcast Limited): closed at ₹146.29, +17.52% on the day, +27.5% over one month
- KANOHAR (Kanohar Electricals Limited): closed at ₹1,091.05, +15.76% on the day, 1 month data unavailable
- PNGSREVA (PNGS Reva Diamond Jewellery Limited): closed at ₹631.00, +15.31% on the day, +16.8% over one month
- CHENNPETRO (Chennai Petroleum Corporation Ltd.): closed at ₹1,612.30, +14.70% on the day, +12.7% over one month
- PRADPME (Pradeep Metals Limited): closed at ₹620.90, +14.08% on the day, +26.5% over one month
- DHANBANK (Dhanlaxmi Bank Limited): closed at ₹32.83, +13.87% on the day, +4.7% over one month
On the opposing side of the ledger, several equities registered notable single-session declines, extending multi-week downward trajectories across varied market capitalization segments.
- LEXUS (Lexus Granito (India) Limited): closed at ₹9.48, -12.30% on the day, -29.1% over one month
- SUPREMEINF (Supreme Infrastructure India Limited): closed at ₹54.67, -10.96% on the day, -36.3% over one month
- AVROIND (AVRO INDIA LIMITED): closed at ₹6.13, -10.51% on the day, -27.9% over one month
- CENTEXT-RE (Century Extrusions Limited-RE): closed at ₹2.16, -10.00% on the day, 1 month data unavailable
- CGVAK (CG Vak Software & Exports Limited): closed at ₹133.80, -8.46% on the day, -9.1% over one month
- MODTHREAD (Modern Threads (India) Limited): closed at ₹45.21, -7.72% on the day, -17.3% over one month
- AMNPLST (Amines & Plasticizers Limited): closed at ₹172.60, -7.66% on the day, +2.6% over one month
- RAJSREESUG (Rajshree Sugars & Chemicals Limited): closed at ₹27.40, -7.37% on the day, -23.2% over one month
- INOXGREEN (Inox Green Energy Services Limited): closed at ₹135.87, -7.31% on the day, -21.1% over one month
- RAYMOND (Raymond Limited): closed at ₹1,206.70, -6.77% on the day, +56.2% over one month
Stocks Near 52-Week Highs and Lows
An evaluation of multi-month price boundaries highlights equities trading in proximity to their annual extremes. A total of 68 stocks closed within 2% of their respective 52-week highs, indicating persistent upward buying interest among a select group of companies. Conversely, 158 stocks finished within 2% of their 52-week lows, pointing to sustained downward momentum in specific segments of the market. Proximity to annual highs and lows is a structural reference point used by quantitative analysts to map out historical volatility ranges and long-term price channels.
Selecting representative equities from both boundaries highlights the specific price levels recorded at the session close.
- CUPID (Cupid Ltd.): closed at ₹343.95, +6.09% on the day, 52-week high ₹345.00
- SUPREMEENG (Supreme Engineering Limited): closed at ₹4.48, +1.82% on the day, 52-week high ₹4.48
- SWANDEF (Swan Defence and Heavy Industries Limited): closed at ₹2,759.40, -0.03% on the day, 52-week high ₹2,804.90
- HFCL (HFCL Ltd.): closed at ₹271.90, +3.47% on the day, 52-week high ₹275.91
- SKFINDIA (SKF India Limited): closed at ₹1,428.90, -2.26% on the day, 52-week low ₹1,404.00
- GENSOL (Gensol Engineering Limited): closed at ₹11.74, -4.94% on the day, 52-week low ₹11.74
- KPITTECH (KPIT Technologies Ltd.): closed at ₹484.25, -1.72% on the day, 52-week low ₹483.40
- KEC (Kec International Ltd.): closed at ₹362.50, -3.31% on the day, 52-week low ₹362.00
We Also Published
- 01
- 02
- 03
- 04
Unusually Heavy Trading Volume
Trading volume serves as an essential liquidity indicator, measuring the total number of shares changing hands during a specific period to gauge institutional participation and conviction. During the October 7 session, 210 stocks traded at least twice their established 20-day average volume, highlighting localized surges in market activity. Heavy volume anomalies often accompany sudden price adjustments, providing quantitative confirmation of heightened participant engagement.
Prominent volume expansions spanned multiple industrial sectors during the session.
- MBEL (M & B Engineering Limited): closed at ₹290.60, day +13.78%, Volume 14.7× average
- LOTUSCHO (Lotus Chocolate Company Limited): closed at ₹646.85, day +11.59%, Volume 13.4× average
- NELCAST (Nelcast Limited): closed at ₹146.29, day +17.52%, Volume 13.1× average
- PRADPME (Pradeep Metals Limited): closed at ₹620.90, day +14.08%, Volume 12.6× average
- PNGSREVA (PNGS Reva Diamond Jewellery Limited): closed at ₹631.00, day +15.31%, Volume 11.6× average
- ORIENTTECH (Orient Technologies Limited): closed at ₹239.80, day +5.94%, Volume 11.3× average
- DHANBANK (Dhanlaxmi Bank Limited): closed at ₹32.83, day +13.87%, Volume 10.4× average
- CINEVISTA (Cinevista Limited): closed at ₹15.37, day +11.14%, Volume 9.2× average
- BIRLANU (BirlaNu Limited): closed at ₹1,321.30, day -6.06%, Volume 8.8× average
- RUDRA (Rudra Global Infra Products Limited): closed at ₹19.46, day +9.26%, Volume 8.8× average
One-Year Performance Extremes
Long-term price trajectories across the NSE exchange demonstrate extreme dispersion when evaluated over a twelve-month horizon. The strongest one-year performers maintained substantial cumulative appreciation despite intermittent daily fluctuations. Relative strength over extended periods helps market observers identify structural leadership within specific industrial categories.
Leading and lagging twelve-month performers are detailed below.
- STLTECH (Sterlite Technologies Ltd.): closed at ₹1,016.80, day +0.01%, 1 year +751.2%
- CUPID (Cupid Ltd.): closed at ₹343.95, day +6.09%, 1 year +700.0%
- SIGMAADV (SIGMA ADVANCED SYSTEMS LTD.): closed at ₹1,091.60, day -2.48%, 1 year +602.9%
- AGASTYAEN (Agastya Energy and Infrastructure Limited): closed at ₹65.47, day -1.99%, 1 year +545.7%
- SUPREMEENG (Supreme Engineering Limited): closed at ₹4.48, day +1.82%, 1 year +446.3%
- BESTAGRO (Best Agrolife Limited): closed at ₹17.59, day -1.68%, 1 year -92.6%
- OSIAHYPER (Osia Hyper Retail Limited): closed at ₹1.91, day -4.50%, 1 year -91.7%
- DELPHIFX (DELPHI WORLD MONEY LIMITED): closed at ₹7.31, day +1.95%, 1 year -90.9%
- INDOTHAI (Indo Thai Securities Limited): closed at ₹40.71, day +4.98%, 1 year -87.5%
- FLEXITUFF (Flexituff Ventures International Limited): closed at ₹3.19, day +1.92%, 1 year -86.1%
How to Read These Numbers
Interpreting quantitative market wraps requires a firm grasp of standard financial nomenclature and statistical measurement techniques. Metrics such as closing prices, volume multipliers, and percentage changes reflect historical transactions executed on the exchange rather than forward-looking projections. Market breadth indicators—such as the proportion of advancing versus declining issues—summarize aggregate sentiment without explaining the underlying corporate catalysts. Quantitative analysis relies on these empirical records to establish baseline volatility and liquidity profiles across diverse asset classes.
Understanding these technical parameters ensures that readers interpret data points with appropriate context. Past price behavior, while informative for historical research, remains inherently non-predictive. Analysts and market participants must evaluate multiple variables and consult qualified professionals before drawing operational conclusions from exchange statistics.
Disclaimer: This article is for general information and education only. It describes what historical prices and technical indicators showed on the date mentioned and does not predict future movements. It is not investment advice, a recommendation, or an offer to buy or sell any security. Indicators are calculated from past data and can mislead, and all investments carry risk. Please consult a SEBI-registered investment adviser before making any financial decision.
From our network :
- How AI Agents Will Change the Way We Manage Personal FinancesExplore how AI agents are transforming personal finance through automated budgeting, bill payment, and investment management, while examining the critical security protocols and governance frameworks required for safe deployment.
- Committed Mediterranean Precipitation Decline: Why Emissions Cuts Alone Cannot Restore Winter RainsNew NOAA research reveals that Mediterranean winter rains may decline irreversibly even with emissions cuts. Explore the science of committed climate change and regional impacts.
- Live Online English Classes for Kids: Do They Actually Reduce Anxiety?A ten-week study reveals that synchronous online English classes can significantly reduce child language anxiety while improving listening and reading skills. Discover what makes these programs effective and how parents can select the right one.
- The Final Descent: How ESA Retired the Legendary Cluster Constellation After 24 Years of Space Weather ScienceAfter 24 years mapping Earth’s magnetosphere, ESA’s Cluster mission concluded with a precisely controlled reentry over the South Pacific. This analysis explores the scientific legacy, engineering decisions, and debris mitigation principles behind one of space exploration’s most responsible retirements.
- CISA’s Ten-Advisory Wave: Why Generic Patching Fails in OT and How to Build Product-Specific PlaybooksCISA released ten ICS advisories in one week, exposing critical infrastructure risks. Generic patching fails in OT. Learn to build product-specific remediation playbooks.
- Forbidden Matrix Patterns and Visible Lattice Points: A Geometric DictionaryExplore how multidimensional 0–1 matrices encode geometric truths, linking forbidden patterns to visible lattice points and hypergraph theory, with applications in combinatorics and computational geometry.
- The Hidden Cost of AI Convenience: Why Over-Permissioned Agents Are a Security Time BombDiscover why AI agents with excessive permissions create dangerous single points of failure, and learn how implementing least privilege principles can protect your organization from exploitation.
- University Language Proficiency Exams: Why Institutional Tests Demand Different Preparation Than IELTS and TOEFLDiscover why university-specific language proficiency examinations differ fundamentally from IELTS and TOEFL, and learn strategic preparation approaches for institutional assessment success.
- Mobile Learning and VR in English: What Global Evidence Reveals About Effective Language TechnologyA systematic review across 14 countries reveals which language-learning technologies genuinely work. Mobile learning, AI, and VR show measurable benefits when pedagogically integrated. This evidence-based guide helps educators and learners select technology that delivers real return on investment.
RESOURCES
- Market Wrap – Week Ended 22nd August 2025 Performance varied ...facebook.comAug 25, 2025 ... MASI (Morocco All Shares Index): Morocco's MASI index closed with ... Kenya (NSE ASI): Kenya's NSE All Share Index (ASI)…
- Nairobi Securities Exchange (NSE)nse.co.keMarket Statistics Summary · NSE ALL SHARE INDEX · NSE 20 SHARE INDEX · NSE 25 SHARE INDEX · TOTAL SHARE TRADED · EQUITY…
- The SIB Kenya Weekly Market Wrap for the week ending 2nd ...facebook.com3 days ago ... Key Market Indicators • NSE All-Share Index: Advanced 1.04% to ... Equities Market The NSE posted a 15.2 % Q-on-Q…
- Stocks Pare Tech-Led Drop as Rotation Gains Speed: Markets Wrapbloomberg.comJun 8, 2026 ... US Stocks: · Today's Markets Wrap · AI Trade Reset · Industrial Earnings Upside · All-Night Stock Exchanges · The…
- Daily Market Wrapkingdomsecurities.co.keNov 4, 2025 ... ... equities market closed mixed, with NASI shedding 0.56% to 189.08, NSE ... all or any identified portion of this…
- Stocks Decline as US-Iran Clashes Drive Oil Higher: Markets Wrapbloomberg.comJun 2, 2026 ... All-Night Stock Exchanges · Anthropic IPO Risk Chase · Stock Movers ... National Stock Exchange (NSE) in Mumbai. Indian Stocks…
- Weekly Market Recap - Manulife John Hancock Investmentsjhinvestments.comGet a market summary with data across U.S. stocks, international and emerging-market equities ... all common stocks listed on the NASDAQ stock exchange. The…
- Sterling Capital – Inspired Financial Solutionssterlingib.comMarket round-up. Industry news, research & tips. All research · Weekly Market Wrap. Weekly summary of equities trading including stock prices ...
- Daily Market Wrap - Kingdom Securities Limitedkingdomsecurities.co.keSep 7, 2026 ... Market Indicators: The equities market closed on a negative note, with all major indices recording losses. NASI, NSE. 10, NSE…
- FAQs on RFQ - NSE Indianseindia.comNSE India (National Stock Exchange) - LIVE stock/share market updates from one of the leading stock exchange ... all operating RFQ Platforms in the…
- Asian Market Headlines | Breaking Stock Market News - Reutersreuters.comFind the latest stock market news from every corner of the globe at Reuters.com, your online source for breaking international market and finance news.
- 2026 Market Outlook | J.P. Morgan Global Researchjpmorgan.com“In addition, a collapse in U.S. equity prices would have knock-on effects for all risk markets, with credit spreads widening. EM would be hit…
- IC Market Wrap: GSE retreats as broad-based selling contrasts with ...ic.africaAug 10, 2026 ... The Nigerian equities market nudged up by 0.1% week-on-week ... The Nairobi Securities Exchange's All Share Index (NSE-ASI) fell by ...
- Nigeria Stock Market NSE - Quote - Chart - Historical Data - Newstradingeconomics.comNigeria's main stock market index, the NSE All Share, fell to 250257 points on October 7, 2026, losing 0.01% from the previous session. Over…
- 01
- 02
- 03
- 04
- 05
- 06
- 07
- 08
0 Comments