Financial market analysis requires an unwavering commitment to empirical data and rigorous observation of historical price movements. Evaluating equity performance on the National Stock Exchange demands a disciplined approach that examines verified closing prices, volume surges, and moving averages without resorting to speculative forecasts. Market participants frequently analyze these quantitative parameters to understand historical volatility, trading ranges, and structural trends across multiple time horizons. By focusing exclusively on verifiable metrics such as day-over-day changes, simple moving averages, and average true range readings, analysts maintain a clear perspective on asset behavior. This objective framework ensures that discussions regarding prominent Indian equities remain grounded in verifiable facts rather than emotional sentiment or unverified market chatter.
Examining market capitalization giants like Reliance Industries Ltd. requires a thorough breakdown of trading sessions, moving average alignments, and volume dynamics. The interplay between short-term momentum and long-term trend indicators provides a comprehensive view of how liquidity flows through high-volume benchmark counters. Institutional and retail participants alike monitor technical indicators to gauge historical price positioning relative to 52-week extremes and moving average thresholds. Through careful examination of closing prices, percentage returns over various timeframes, and volatility metrics, observers gain deep insight into the structural mechanics governing modern stock exchanges. Every numerical value recorded in official exchange datasets serves as a building block for constructing an accurate narrative of recent trading activity.
TL;DR Reliance Industries Ltd. closed at ₹1,218.00 on 6 Oct 2026, marking a day change of +2.66% on a volume of 1.80 Cr shares.
On This Page
Session Snapshot and Price Action
The trading session concluded with Reliance Industries Ltd. posting a notable upward movement, reflecting shifting immediate sentiment on the National Stock Exchange. The closing price settled at ₹1,218.00, registering a day-over-day change of +2.66% compared to the previous close of ₹1,186.40. Throughout the session, the asset traversed a day range spanning from a low of ₹1,188.10 to a high of ₹1,219.10. These figures encapsulate the immediate intraday volatility and establish the boundaries within which market participants executed transactions during the trading hours of 6 Oct 2026.
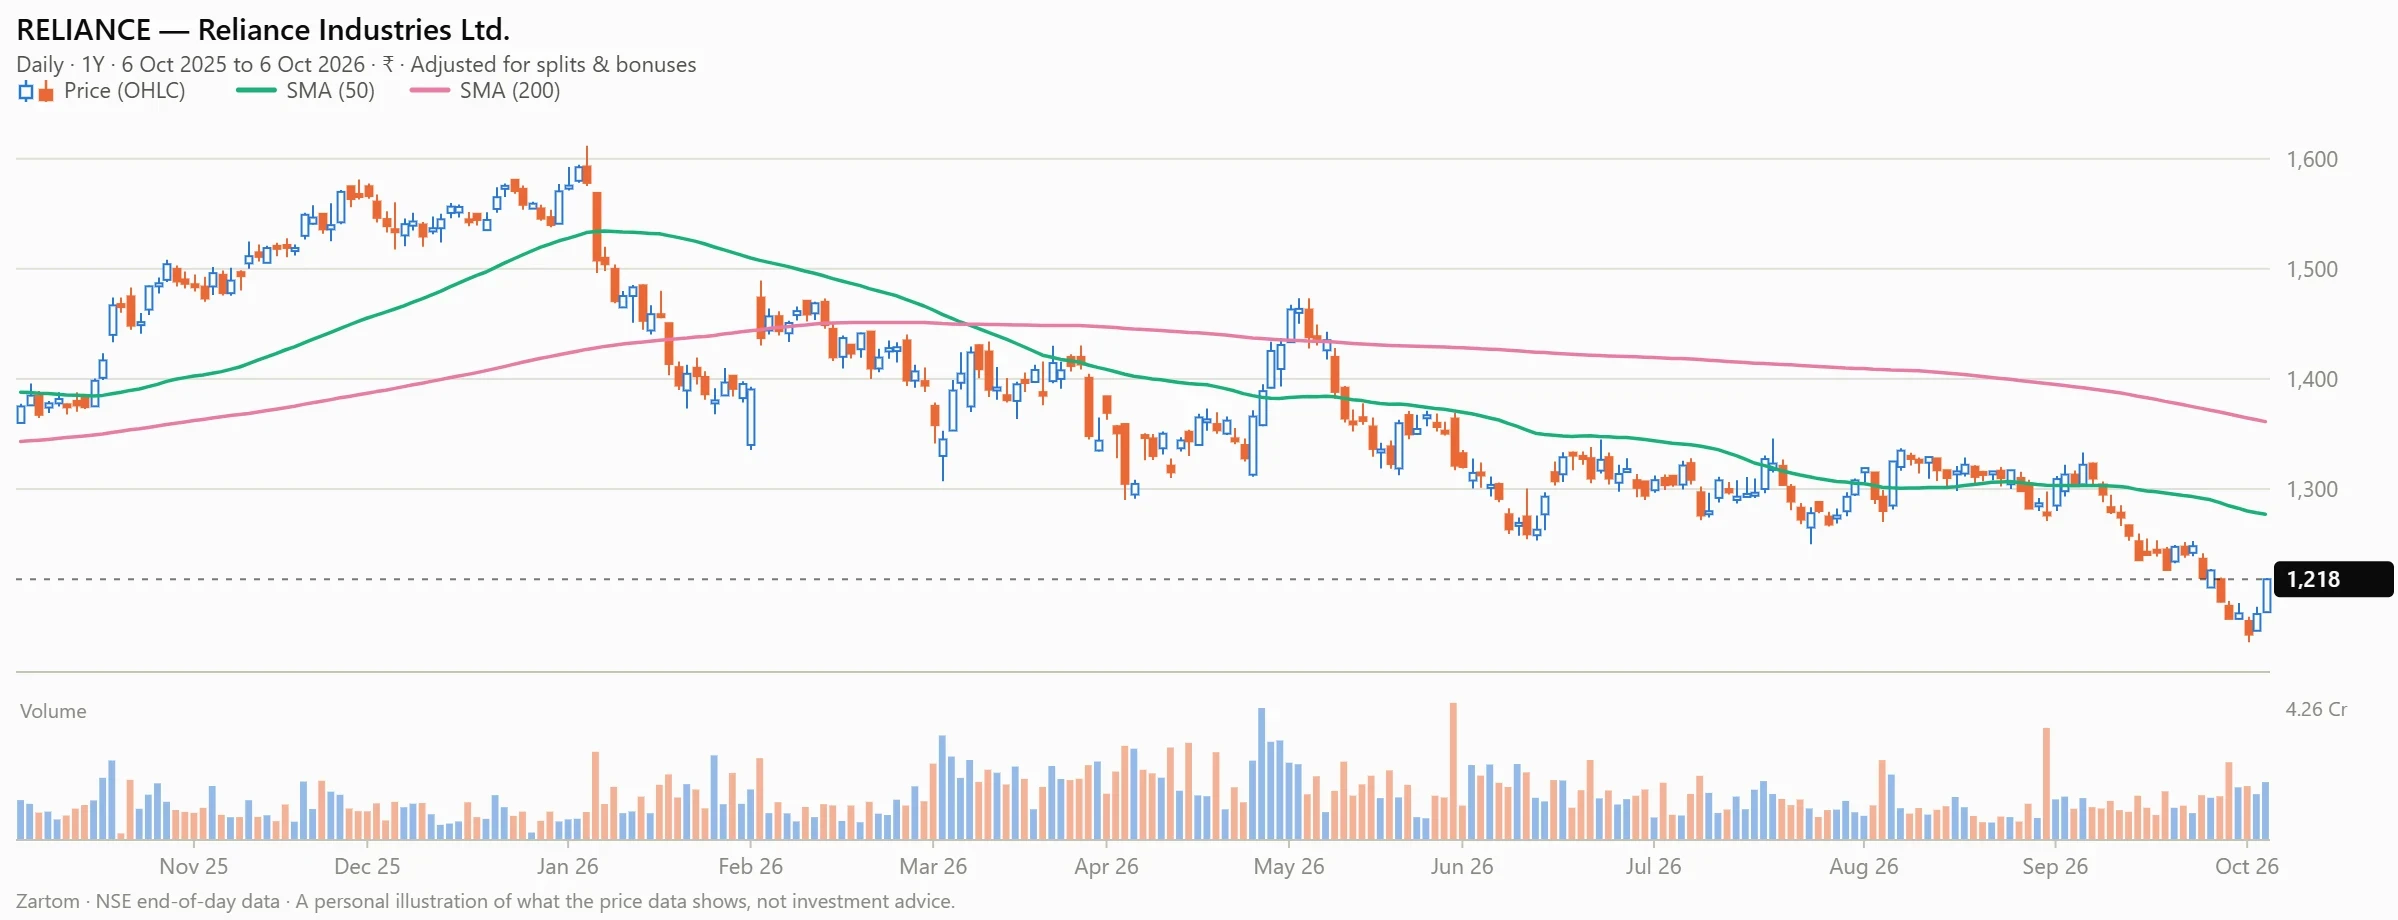
Contextualizing this single-session movement requires examining the broader trading parameters recorded on the exchange. The total volume reached 1.80 Cr shares, representing a significant volume surge against the 20-day average volume of 1.28 Cr shares, which measures the typical number of shares traded daily over the preceding twenty sessions. This heightened liquidity underscores the active participation observed during the session, setting the stage for a deeper exploration of historical performance extremes and multi-period return metrics across the equity structure.
We Also Published
Returns Across Multiple Time Horizons
Analyzing equity performance necessitates evaluating percentage changes across various intervals to capture short-term momentum and long-term trajectory. Over a 5-day period, the closing price advanced by +3.0%, showing a modest rebound in the immediate past sessions. However, looking further back across a 1-month interval reveals a decline of -7.9%. This pattern highlights the fluctuating nature of the equity's valuation as it interacts with broader market conditions on the exchange.
Extended timeframes provide additional clarity regarding the trajectory of Reliance Industries Ltd. across quarterly and yearly intervals. Over 3 months, the closing price contracted by -6.9%, while the 6-month horizon recorded a change of -6.6%. On a 1-year basis, the stock experienced a decline of -11.4%. Conversely, looking at a 3-year span, the price registered a positive change of +5.1%, illustrating the net accumulation over a longer multi-year holding duration.
Trend and Moving Average Analysis
Moving averages offer structural reference points for understanding where a stock trades relative to its historical mean. The 50-day simple moving average stands at ₹1,277.14, while the current closing price of ₹1,218.00 is 4.6% below this indicator. Furthermore, the 50-day average itself is falling over the last 20 days. This relationship highlights the intermediate downward slope observed in recent trading weeks.
A similar observation applies to the longer-term benchmark tracking indicator used by analysts. The 200-day simple moving average is positioned at ₹1,361.18, with the closing price resting 10.5% below this threshold. Like its shorter counterpart, the 200-day average is also falling over the last 20 days. Additionally, the positioning shows that the 50-day average remains below the 200-day average, establishing the prevailing alignment of these two technical averages.
Momentum and Volatility Readings
Volatility and range-based metrics offer quantitative insight into the magnitude of daily price fluctuations. The annualised volatility of daily returns calculated over the last 60 sessions stands at 19.7%, which measures the degree of variation of trading prices over time. Additionally, the 14-day average true range is 1.8% of the close, measuring the average size of price ranges across fourteen sessions. These statistical figures quantify the rhythmic swings characteristic of the equity's recent trading environment.
Further examination of extreme single-day performances within the last three months highlights specific sessions of heightened activity. The best single day in this window occurred on 6 Aug 2026 with a positive change of +3.52%. Conversely, the worst single-day movement was recorded on 8 Jul 2026 at -2.48%. These boundary markers outline the extremes of daily price variation observed during the preceding quarter without attributing external catalysts.
- 01
- 02
- 03
- 04
Risk Context and 52-Week Extremes
Placing current price levels into a one-year perspective involves examining 52-week highs, 52-week lows, and maximum drawdowns. The 52-week high was recorded at ₹1,611.80 on 5 Jan 2026, placing the current close of ₹1,218.00 at 24.4% below that peak. Conversely, the 52-week low was established at ₹1,160.80 on 1 Oct 2026, leaving the closing price 4.9% above that trough. These parameters define the yearly boundary spectrum within which the stock has oscillated.
Further analysis of drawdown metrics reveals the extent of correction from previous closing peaks. The deepest fall from a closing high within the last year reached 26.7%, illustrating the maximum downward retracement experienced by the equity over the trailing twelve-month window. Additionally, corporate actions during the period included a dividend of ₹6 per share with an ex-date of 5 Jun 2026, marking a verified capital distribution event recorded in the official software database.
Technical Data Interpretation and Summary
Synthesizing the complete set of verified facts provides a cohesive overview of the technical standing of Reliance Industries Ltd. as of 6 Oct 2026. The data demonstrates how closing prices interact with moving average structures, volume benchmarks, and historical volatility parameters. By examining these quantitative records without speculation, market analysts maintain an objective understanding of price distribution and liquidity patterns across exchange-listed securities.
This is a personal illustration of what the price data and technical indicators show on the date above. It is not investment advice, a recommendation, or an offer to buy or sell any security. Past performance does not guarantee future results.
From our network :
- University Language Proficiency Exams: Why Institutional Tests Demand Different Preparation Than IELTS and TOEFLDiscover why university-specific language proficiency examinations differ fundamentally from IELTS and TOEFL, and learn strategic preparation approaches for institutional assessment success.
- Mobile Learning and VR in English: What Global Evidence Reveals About Effective Language TechnologyA systematic review across 14 countries reveals which language-learning technologies genuinely work. Mobile learning, AI, and VR show measurable benefits when pedagogically integrated. This evidence-based guide helps educators and learners select technology that delivers real return on investment.
- The Hidden Cost of AI Convenience: Why Over-Permissioned Agents Are a Security Time BombDiscover why AI agents with excessive permissions create dangerous single points of failure, and learn how implementing least privilege principles can protect your organization from exploitation.
- The Final Descent: How ESA Retired the Legendary Cluster Constellation After 24 Years of Space Weather ScienceAfter 24 years mapping Earth’s magnetosphere, ESA’s Cluster mission concluded with a precisely controlled reentry over the South Pacific. This analysis explores the scientific legacy, engineering decisions, and debris mitigation principles behind one of space exploration’s most responsible retirements.
- CISA’s Ten-Advisory Wave: Why Generic Patching Fails in OT and How to Build Product-Specific PlaybooksCISA released ten ICS advisories in one week, exposing critical infrastructure risks. Generic patching fails in OT. Learn to build product-specific remediation playbooks.
- How AI Agents Will Change the Way We Manage Personal FinancesExplore how AI agents are transforming personal finance through automated budgeting, bill payment, and investment management, while examining the critical security protocols and governance frameworks required for safe deployment.
- Forbidden Matrix Patterns and Visible Lattice Points: A Geometric DictionaryExplore how multidimensional 0–1 matrices encode geometric truths, linking forbidden patterns to visible lattice points and hypergraph theory, with applications in combinatorics and computational geometry.
- Live Online English Classes for Kids: Do They Actually Reduce Anxiety?A ten-week study reveals that synchronous online English classes can significantly reduce child language anxiety while improving listening and reading skills. Discover what makes these programs effective and how parents can select the right one.
- Committed Mediterranean Precipitation Decline: Why Emissions Cuts Alone Cannot Restore Winter RainsNew NOAA research reveals that Mediterranean winter rains may decline irreversibly even with emissions cuts. Explore the science of committed climate change and regional impacts.
RESOURCES
- Technical Analysis of Reliance Industries Limited (NSE:RELIANCE)in.tradingview.comIndicators' summary ... See technical analysis overview for the selected timeframe. It includes key data from moving averages, oscillators, and pivots — all ...
- Reliance Industries RSI, Moving Averages, Technical Analysis ...trendlyne.comDay Trendlyne Momentum Score. 31.1. Score is 31.13, stock is technically weak. Stocks with score below 35 or in the bottom 30% are considered…
- Reliance Industries (500325) - Technical Analysis - Investtechinvesttech.comInvestors have accepted lower prices over time to get out of Reliance Industries Ltd. and the stock is in a falling trend channel in…
- Reliance Industries (RELI) Technical Analysis - Investing.com Indiain.investing.comThe technical indicators for Reliance Industries are in a Strong Sell position based on daily analysis, with 2 signals on buy indicators and 7…
- #RILResults Q1 2026-27 now available in Metaverse. Visit: https://ril ...instagram.comJul 19, 2026 ... Technical Analysis: RIL closed at ₹1,322 on September 4, with the stock ... analysis of Reliance Industries Ltd. The analysis…
- Reliance Industries Technical Analysis - Indicators, Support ... - Growwgroww.inBased on 1D data. Based on technicals, this stock is. Strongly bearish.
- Reliance Industries Ltd. Technical Analysis: SMA, RSI, EMA, MFIetmoney.comGet detailed RELIANCE technical analysis insights and understand its trend. Explore Reliance Industries Ltd. technical analysis, including EMA, SMA, ...
- RELIANCE Share Price — NSE:RELIANCE - TradingViewtradingview.comTrack Reliance Industries Limited stock price today with the live chart. Find RELIANCE news, trading ideas, forecasts, financials, and more.
- Technical Analysis of Reliance Industries Ltd ... - Top Stock Researchtopstockresearch.comTSR Tech Strength for RELIANCE is an AI-powered score that helps you understand a stock's technical strength. It analyzes 100+ technical indicators, historical ...
- Reliance Industries Limited (RELIANCE.NS) - META_TITLE_QUOTEfinance.yahoo.comSUMMARY · NEWS · RESEARCH · CHART · COMMUNITY · STATISTICS · HISTORICAL_DATA · COMPANY_PROFILE · FINANCIALS · ANALYSIS · OPTIONS · HOLDERS. NSE…
- Reliance Industries Stock Price Today | NSE: RELI Liveinvesting.comThe Reliance Industries stock price today is 1,218.00 INR. What Stock Exchange Does Reliance Industries Trade On? Reliance Industries is ...
- Modest Gains Amid Broad Support Zone - Mutual Fund Flowslbcmadhyapradesh.inJun 15, 2026 ... Reliance (RELIANCE.NS) market analysis | technical strength, valuation metrics, earnings momentum. Reliance Industries Limited (RELIANCE.
- RELI Technical Analysis, RSI and Moving Averages - Investing.cominvesting.comThe technical indicators for Reliance Industries are in a Strong Sell position based on daily analysis, with 0 signals on buy indicators and 7…
- Reliance Industries Technical Analysis 2026 | Resistance & Supportchoiceindia.comThe pivot point is positioned at ₹1183.53, serving as the central reference for market sentiment. On the upside, the stock faces resistance near ₹1195.86,…
- RIL Financial Reporting – Annual & Quarterly Reports | Highlightsril.comStock Chart · Historical Stock Price · Investment Calculator · Dividend & Shares ... © 2026 Reliance Industries Limited. All rights reserved. Subscribe to ...
- 01
- 02
- 03
- 04
- 05
- 06
- 07
- 08
0 Comments